Data science shows up everywhere: recommendations on streaming apps, fraud detection in payments, dashboards in meetings, and the forecasts companies use to plan budgets. But for beginners, the topic often feels like a wall of jargon.
This guide explains data science in plain English, and—more importantly—shows you how the work is done end-to-end. You will learn the workflow, the most common tools, how data science differs from analytics and machine learning, and what to learn first if you want to go deeper.
What you will be able to do after this guide
You will be able to: (1) describe what data science is in one sentence, (2) sketch the workflow from question to results, (3) pick beginner tools confidently (spreadsheets vs SQL vs Python), and (4) start a small project without getting stuck.
1. What Is Data Science?
At its core, data science is the practice of using data to support decisions and build data-powered products. It combines:
- Domain knowledge: context (product, marketing, finance, healthcare, operations).
- Statistics: reasoning about uncertainty, variation, and measurement.
- Tools & programming: collecting, cleaning, analyzing, and visualizing data efficiently.
A simple definition that works in the real world: data science turns raw data into decisions you can defend (with evidence, limitations, and next steps).
What data science is NOT
- Not only machine learning: many projects end as analysis or experiments, not models.
- Not just dashboards: dashboards are useful, but DS often includes deeper measurement and prediction.
- Not magic: outcomes depend on data quality, definitions, and careful evaluation.
2. Why Data Science Matters in 2025
Organizations collect more data than ever (clicks, app events, transactions, sensors, support tickets). Data science helps convert that raw information into outcomes like:
- Better decisions: fewer “opinions-only” debates.
- Improved products: measuring what users do, not what they say.
- Efficiency: spotting bottlenecks, waste, or operational risk.
- Personalization: relevant content and offers at scale.
- Risk reduction: fraud signals, anomaly detection, and forecasting.
Key limitation beginners should know
More data does not automatically mean better decisions. Bad definitions, biased sampling, or missing context can produce confident-looking but wrong results.
3. Key Data Science Concepts in Plain English
Here are the terms you will see most often, explained in a way that helps you work:
- Dataset: a structured collection of data (rows = records, columns = attributes).
- Feature: an input column used for analysis or modeling (e.g., “country”, “age”, “session_count”).
- Label / target: what you want to predict (e.g., churn, fraud, delivery time).
- EDA (Exploratory Data Analysis): quick analysis + visuals to understand the data and check assumptions.
- Baseline: a simple reference approach you compare everything against (crucial in real projects).
- Overfitting: when a model learns noise and performs poorly on new data.
- Data leakage: when the model accidentally “sees the future” (inflates performance).
Beginner mental model
Most data work is a loop: measure what is happening, form a hypothesis, test it (with data or an experiment), then improve. You do not need complex math to start—clarity and correctness matter more.
4. The Data Science Workflow Step by Step
Data science projects vary, but the workflow is surprisingly consistent. The best way to learn is to internalize the sequence and practice it on small datasets.
End-to-end workflow (diagram)

- Define the question: what decision are we supporting, and what metric represents success?
- Collect data: databases, CSV exports, APIs, logs, surveys—document the source and meaning.
- Clean and validate: missing values, duplicates, outliers, inconsistent categories, wrong date ranges.
- Explore (EDA): distributions, trends, segments, correlations (careful: correlation ≠ causation).
- Model (optional): use statistics or ML when it truly helps (start with a baseline).
- Evaluate: pick correct metrics, avoid leakage, test on unseen data, do error analysis.
- Communicate: turn outputs into decisions (summary, charts, limitations, next steps).
- Deploy and monitor: if it’s a model or automated report, track drift and performance over time.
Beginner shortcut that works
Spend extra time on steps 1–3 (question, definitions, data quality). Many “hard ML problems” disappear when the dataset is corrected and the goal is clarified.
5. Real-World Examples of Data Science
Practical examples you can relate to:
- Streaming platforms: recommendation systems and ranking.
- Online stores: “bought together” suggestions, demand forecasting, price optimization.
- Marketing: attribution, channel ROI, lift measurement, segmentation.
- Finance: credit scoring, anomaly detection, fraud signals.
- Healthcare: risk prediction and operational planning (with strict privacy requirements).
- Operations: route planning, inventory forecasting, quality monitoring.
Real-life example
An online shop wants to reduce cart abandonment. A data scientist measures drop-offs by step, identifies a high-friction screen, proposes a change, and validates the improvement with an experiment and guardrail metrics.
6. Core Tools & Skills in Data Science
You do not need every tool at once. A realistic beginner stack is:
- Spreadsheets: small datasets, quick cleaning, pivot tables, basic charts.
- SQL: extracting and aggregating data from databases (highly demanded in jobs).
- Python (or R): reproducible analysis, automation, and modeling (pandas, NumPy).
- Visualization: simple charts with clear labels beat complicated plots.
- Stats literacy: distributions, confidence intervals, experimentation basics.
- Communication: writing a short decision-oriented summary is a core DS skill.
A beginner-friendly “tool decision” rule
- Spreadsheets if data is small and the goal is quick exploration.
- SQL if data lives in a database and you need correct aggregation/joins.
- Python if you need repeatability, automation, or more advanced analysis.
7. Data Science vs Data Analytics vs Machine Learning
These terms overlap, but they emphasize different outcomes:
- Data Analytics: describes what happened (dashboards, reporting, trends).
- Data Science: full workflow—measure, explain, test, and sometimes predict.
- Machine Learning: models that learn patterns to predict or automate decisions.
How they relate (diagram)
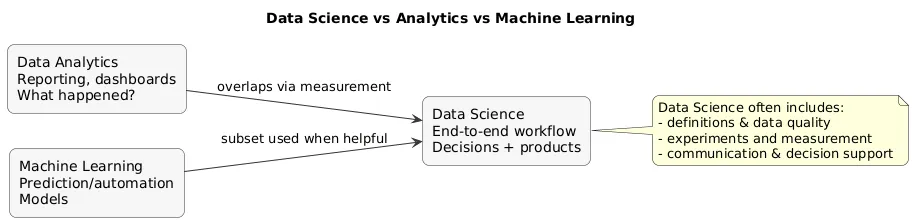
In small companies, one person may do all of this. In larger companies, roles split into data analyst, data scientist, ML engineer, analytics engineer, or data engineer.
8. How to Start Using Data in Everyday Work
You do not need the title “data scientist” to benefit from data thinking. Start with:
- Track simple metrics: “requests per day”, “conversion rate”, “time to resolution”.
- Use small experiments: try A vs B and measure impact with one primary metric + one guardrail.
- Visualize regularly: a trend line and a breakdown by segment solve many problems.
- Write assumptions: what you excluded, what you counted, and why.
Pro tip
Keep a “decision log”: the metric you used, what you decided, and what happened later. It builds intuition and makes you more credible over time.
9. Learning Path If You Want to Become a Data Scientist
The most reliable approach is to learn in layers and ship small projects at every stage. Do not wait until you “finish the theory” to start practicing.
Learning path (diagram)

- Step 1 – Foundations: averages, percentages, basic charts, and clear metric definitions.
- Step 2 – Spreadsheets: cleaning, pivot tables, simple dashboards.
- Step 3 – SQL: joins, GROUP BY, CTEs, window functions (high ROI).
- Step 4 – Python (or R): pandas for cleaning/analysis; reproducible notebooks.
- Step 5 – Statistics: variation, confidence intervals, basic experiment thinking.
- Step 6 – ML basics: baseline models, correct evaluation, leakage awareness.
- Step 7 – Portfolio: 2–4 end-to-end projects with clear READMEs and honest limitations.
Mini-project ideas (beginner-friendly)
- EDA project: pick a dataset, clean it, and publish 5–8 visuals + a one-page summary.
- SQL project: answer 10 business questions with joins + windows (cohorts/funnels).
- Simple prediction: churn or pricing baseline with leakage checks and error analysis.
- Time series: forecast weekly demand with time-aware validation (no random split).
If you want a job-oriented roadmap
Continue here: How to Become a Data Scientist.
10. Data Science at Work: Roles & Collaboration
Data science is rarely solo. Typical collaboration:
- Product managers: define goals and success metrics.
- Engineers: build pipelines and integrate insights/models into products.
- Design & marketing: use insights to shape user experiences and campaigns.
- Executives: need clear, decision-ready summaries.
In real teams, the “best” analysis is often the one that is simple, correct, and used—rather than the most complex model.
11. Frequently Asked Questions About Data Science
Do I need advanced math to learn data science?
For beginner and intermediate work, no. You can go far with basic algebra, averages, and an intuitive understanding of uncertainty. Advanced math becomes more useful later (especially for deep learning), but it is not the entry barrier many people fear.
Do I need to know programming before I start?
Not necessarily. Start with spreadsheets and simple analysis. Programming becomes important when you need repeatability, automation, or larger datasets.
How long does it take to get job-ready?
It depends on your background and time. Many people move into junior roles within 6–12 months with consistent practice and a strong portfolio. Shipping projects is the fastest path to credibility.
12. Final Thoughts & Next Steps
Data science is not a single skill—it is a workflow. Start small: pick a dataset, ask one clear question, clean the data, build a few charts, and write a short summary with limitations.
If you want to go further, browse the Data Science guides where each topic is broken into practical, beginner-friendly steps.
Key data science terms (quick glossary)
- Data Science
- A field that combines statistics, programming, and domain knowledge to extract insights and value from data.
- Dataset
- A structured collection of data, usually rows (records) and columns (features).
- Feature
- An input variable used in analysis or modeling, such as age, country, or number of purchases.
- Label (Target)
- The value a model predicts, for example whether a customer will churn.
- EDA
- Exploring data with summary statistics and visuals to understand patterns and validate assumptions.
- Baseline
- A simple reference approach used to check whether a more complex method adds real value.
- Overfitting
- When a model fits training data too closely and performs poorly on new data.
- Data Leakage
- When evaluation uses information that would not exist at prediction time, creating misleadingly high performance.
Worth reading
Recommended guides from the category.