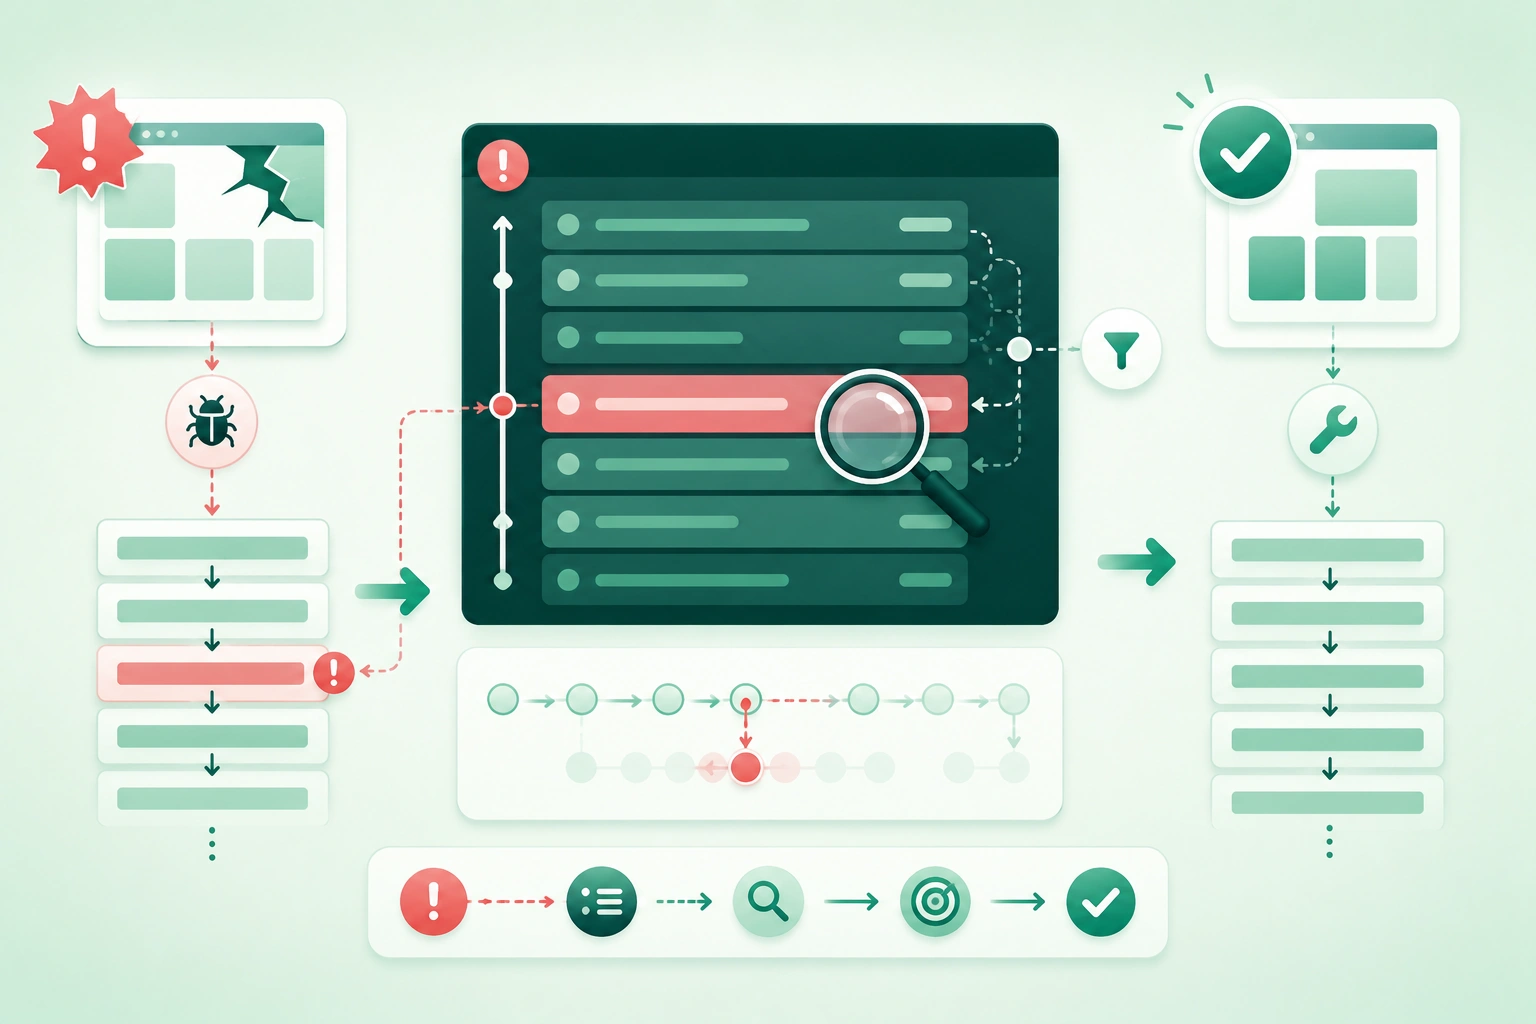
Stack traces often look intimidating because they contain:
exception names
function names
file paths
line numbers
framework internals
generated methods
async machinery
dozens of frames
But most traces answer a relatively small set of questions:
What failed?

Where did it fail?

Which calls led there?

Which part belongs to my code?

What state made the failure possible?
Once you learn to separate those questions, even a long trace becomes a map rather than a wall of text.
A stack trace is evidence, not the diagnosis
The trace usually identifies where execution failed and the call path that reached that point. It does not automatically explain why the program entered the invalid state. The root cause may be several functions, requests, threads, or asynchronous operations earlier.
1. Understand what a stack trace represents
When functions call other functions, a runtime typically tracks enough execution state to know where control should return.
Consider:
main()
  ↓
loadUser()
  ↓
parseProfile()
  ↓
readDate()
If readDate() fails, the runtime may report a call chain
resembling:
readDate
parseProfile
loadUser
main
Each entry is commonly called a:
stack frameA trace answers "how did execution get here?"
This is different from:
what caused the bad data?For example:
readDate()
throws because date is null
but the real defect might be:
API mapping
incorrectly converted
missing date to null
Not every runtime prints a trace the same way
Languages and runtimes differ in:
- Frame order.
- Exception formatting.
- How nested causes appear.
- Whether async frames are reconstructed.
- Whether module and package names are shown.
The method in this guide therefore focuses on concepts rather than one language's punctuation.
2. Learn the anatomy of a stack trace
Stack trace anatomy and call flow (diagram)

A conceptual trace might look like:
InvalidDateError: expected ISO date, got null

at readDate(profile.ts:82)
at parseProfile(profile.ts:41)
at UserRepository.load(user-repository.ts:118)
at RequestHandler.handle(request-handler.ts:64)
at Framework.dispatch(framework.ts:912)
Exception type
InvalidDateErrorThis classifies the failure.
Common categories include:
null / nil reference
type error
index error
validation error
I/O error
database error
network error
timeout
assertion failure
Message
expected ISO date, got nullOften this is the most valuable first clue.
Compare:
Operation failedwith:
expected non-empty user ID,
received empty string
Good error messages dramatically reduce debugging time.
Function or method name
parseProfiletells you which executable unit was active.
Source file
profile.tsLine number
82usually points near the operation that failed.
Module, package, class, or namespace
Some runtimes provide:
com.example.users.UserRepository.load

Users.ProfileParser.parse

module.submodule.function
These help identify ownership when function names are generic.
3. Determine which direction to read
A common beginner rule says:
always read the stack trace
from the top
or:
always read it from the bottomNeither rule is universally safe.
First identify the formatting convention
Determine:
Where is the exception message?

Which frame is closest
to the actual failure?

Which frame represents
the original entry point?
Conceptual call chain
main
 ↓
controller
 ↓
repository
 ↓
parser
 ↓
crash
A runtime might print:
crash
parser
repository
controller
main
Another diagnostic format may visualize the chain differently.
Find the failing frame first
Ask:
Which operation directly
raised or reported the error?
Then move outward through callers.
But do not stop at the failing frame
If:
parseInt(value)failed because:
value = "unknown"the important question becomes:
Who supplied "unknown",
and why was it accepted?
4. Find the first relevant application frame
Real traces often contain many framework frames:
Framework.invoke
Runtime.dispatch
EventLoop.run
Thread.execute
Internal.call
...
followed by one useful line:
CheckoutService.calculateTotal(checkout.ts:144)Separate ownership
Classify frames as:
your application

your shared library

third-party dependency

language runtime

operating system
Start with the nearest relevant application frame
This often provides the fastest entry into investigation.
For example:
DatabaseDriver.execute(...)
DatabaseSession.query(...)
OrderRepository.find(...)
CheckoutService.loadOrder(...)
The database driver may be where the exception originates, but:
OrderRepository.find(...)may be where your application supplied the incorrect query, transaction, parameter, or connection state.
Do not automatically blame the dependency
A library may correctly reject:
invalid URL
closed transaction
malformed JSON
unsupported encoding
missing configuration
supplied by your application.
Do not automatically ignore dependency bugs either
If application inputs are valid and reproduction points inside a dependency, investigate:
- Known dependency issues.
- Version regressions.
- Unsupported usage.
- Platform incompatibility.
5. Separate the crash location from the root cause
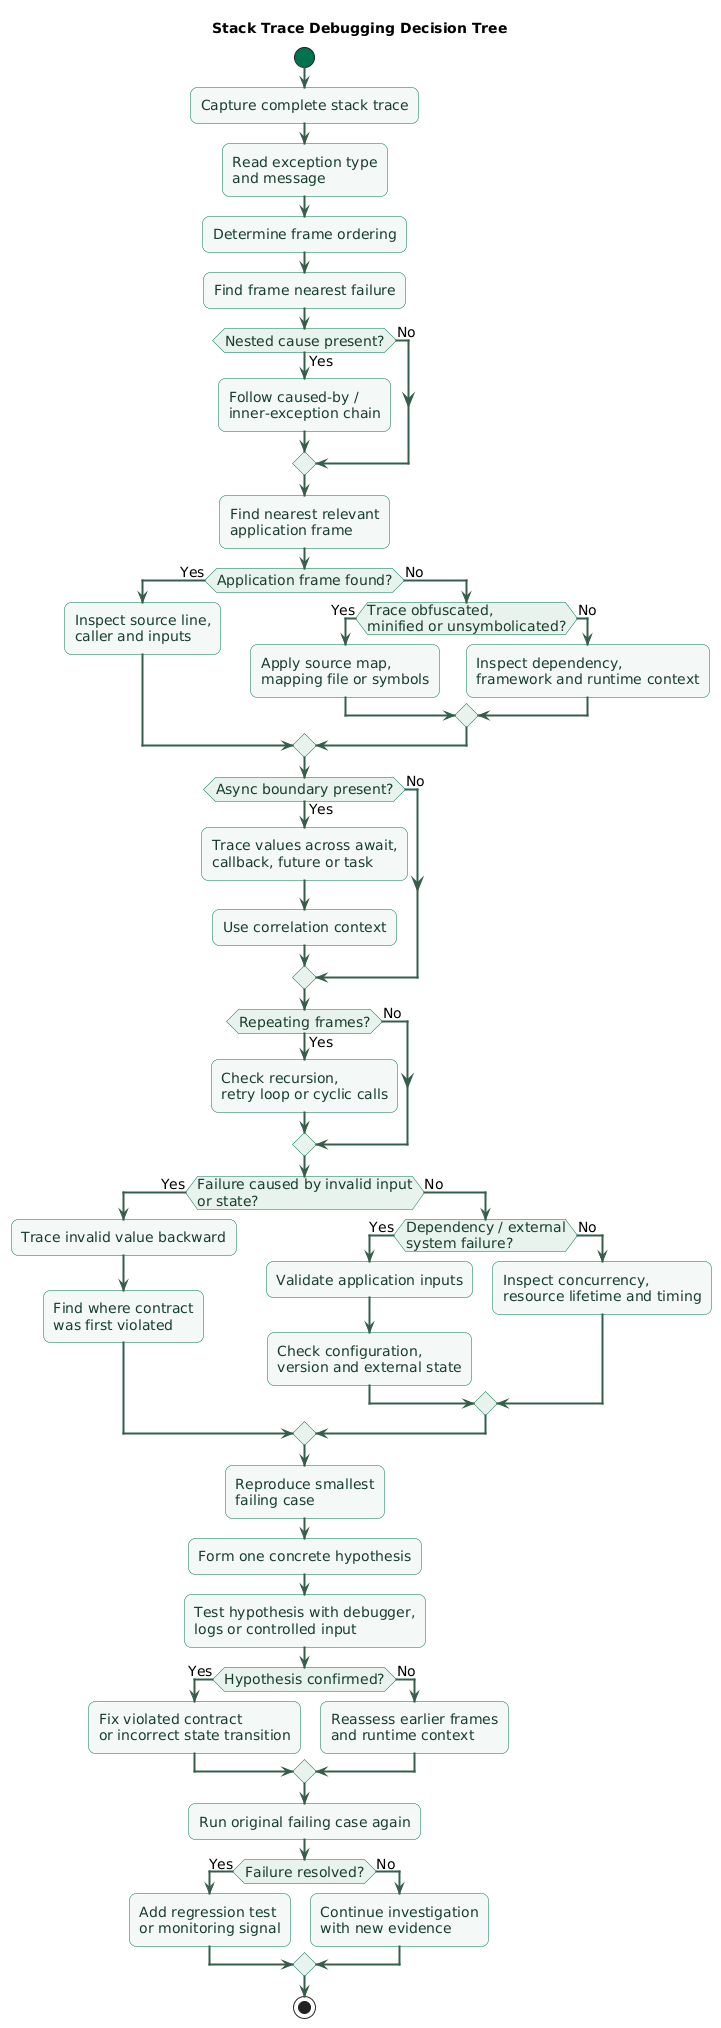
Stack trace root-cause debugging decision tree (diagram)
Imagine:
NullReferenceError
at renderAvatar(user.avatar.url)
It is tempting to fix:
if avatar != nullimmediately.
But first ask:
Should avatar ever be null here?Possibility 1: null is valid
Then the bug is:
UI failed to handle
a legitimate state
Possibility 2: null is invalid
Then the root cause might be:
bad API response

incorrect deserialization

database corruption

partial object construction

race condition
Use the trace to walk backward through assumptions
renderAvatar()
assumes avatar exists

      ↑

renderUser()
passes user

      ↑

repository
constructs user

      ↑

API response
omits avatar
The best fix belongs at the violated contract
Depending on product semantics:
API validates avatar

or

model marks avatar optional

or

UI handles missing avatar
is better than adding arbitrary null checks everywhere.
6. Follow nested and wrapped exceptions
Applications often add context by wrapping lower-level failures.
Example
CheckoutError:
Could not complete payment

Caused by:

PaymentGatewayError:
Request failed

Caused by:

TimeoutError:
No response after 10 seconds
Each layer tells you something different.
Outer exception
Could not complete paymentexplains the application-level operation.
Middle exception
PaymentGatewayErroridentifies the failing subsystem.
Deep cause
TimeoutErrorreveals the immediate underlying failure.
Do not stop at the first exception message
Generic wrapper messages such as:
Failed to process requestmay hide:
duplicate key
invalid certificate
permission denied
connection refused
timeout
Deepest does not always mean root cause
Suppose the deepest cause is:
FileNotFoundError:
config.json
The real root cause may still be:
deployment package
forgot to include config.json
Suppressed or secondary exceptions
Some runtimes report additional failures that occurred while cleaning up or closing resources.
Example:
primary:
database write failed

secondary:
connection close also failed
Preserve the distinction so the cleanup error does not hide the original failure.
7. Read async, callback, and concurrent traces
Synchronous execution is relatively easy to visualize:
A()
 ↓
B()
 ↓
C()
 ↓
failure
Async execution can look more like:
A()
 ↓
schedule request

event loop
 ↓
network completes

callback
 ↓
B()
 ↓
failure
The physical call stack may no longer contain A
By the time the callback runs, the original synchronous stack may be gone.
Runtimes and tooling may reconstruct:
logical async stackor show markers such as:
async boundary
await
promise callback
future
coroutine continuation
task runner
Treat scheduler frames as boundaries
For example:
loadProfile()
  ↓
await HTTP request

--- async boundary ---

handleResponse()
  ↓
parseProfile()
  ↓
failure
Ask what data crossed the boundary.
Capture correlation context
Useful context includes:
request ID
job ID
user-safe correlation ID
task name
message ID
operation name
so separate log events can be connected.
Concurrency introduces timing failures
A stack trace might show:
readState()
throws because state is closed
while another thread or task performed:
closeState()moments earlier.
One thread's trace may therefore be insufficient.
Inspect all relevant execution contexts
For deadlocks, races, or crashes involving shared state, capture:
multiple thread stacks
task states
lock ownership
scheduler events
8. Recognize recursion and repeating frames
A trace containing:
parseNode()
parseNode()
parseNode()
parseNode()
parseNode()
...
often suggests recursion.
Legitimate recursion
Tree traversal may intentionally call itself.
Infinite recursion
A missing base condition can eventually produce:
stack overflow
maximum recursion depth
runtime stack exhaustion
Mutual recursion
A()
 ↓
B()
 ↓
A()
 ↓
B()
 ↓
...
can be less obvious than one function repeating.
Repeated framework frames may mean something else
Repetition can also arise from:
- Event dispatch.
- Retry loops.
- Middleware chains.
- Recursive rendering.
- Serialization cycles.
Look for the repeating unit
Reduce:
200 framesmentally to:
A → B → C → Aand inspect why the cycle never terminates.
9. Decode production, minified, and native traces
Development traces might show:
CheckoutService.calculateTotal
checkout-service.ts:144
while production reports:
a.b(c.js:1:182744)or:
0x00000001004A8F24
0x00000001002C14D0
Generated or bundled languages
If source code is transformed into another representation, you may need:
source mapsto map:
bundle.js:1:182744back to:
checkout-service.ts:144Obfuscation
Release tooling may convert:
UserRepository.loadUserinto:
a.bA mapping artifact is required to reverse that transformation.
Native binaries
Native crash reports may contain:
memory addresses
binary offsets
module names
rather than readable function names.
Symbol files can translate those addresses into useful symbols and source locations.
Keep artifacts for every release
Store the exact:
source map
obfuscation mapping
debug symbols
build ID
commit
release version
needed to decode traces from that build.
Do not symbolicate with the wrong build
A mapping file from:
version 8.4.1may produce misleading results for:
version 8.4.2even if the source looks similar.
10. Combine the trace with runtime context
A trace alone may tell you:
IndexError
at Cart.removeItem(cart.ts:84)
but not:
index = 7
cart size = 3
Capture useful state
Depending on the system:
operation
request ID
route
feature flag
app version
dependency version
safe input metadata
thread / task
environment
Do not log secrets
Stack traces and surrounding logs can accidentally expose:
passwords
access tokens
API keys
session identifiers
personal data
database credentials
Redact or avoid sensitive values.
Exact input is often useful in development
If:
parsePrice("12,4.5")fails, reproducing that exact input may explain the bug immediately.
Production needs safer context
Instead of logging:
full payment payloadlog safer information such as:
operation:
payment_validation

field:
amount

failure:
invalid_decimal_format
Time matters
Inspect logs immediately before the trace:
12:03:11 request started
12:03:12 cache miss
12:03:13 database timeout
12:03:13 retry started
12:03:14 transaction closed
12:03:14 stack trace
The sequence may reveal the failure mechanism more clearly than the trace alone.
11. Use a repeatable debugging workflow
Stack trace root-cause triage workflow (diagram)

Step 1: capture the complete trace
Do not copy only:
NullReferenceErrorwhen the full trace contains the useful location.
Step 2: read the exception message
Write down:
error type
message
failing operation
Step 3: determine frame ordering
Identify:
nearest frame to failure
and
outer callers
Step 4: find your code
Locate the nearest frame controlled by your application.
Step 5: inspect nested causes
Expand:
caused by
inner exception
aggregate failure
suppressed exception
sections.
Step 6: read several frames around the boundary
One frame is often insufficient.
Inspect:
caller
failing function
callee / library boundary
Step 7: inspect inputs and state
Use:
debugger
breakpoint
logs
watch expressions
test fixture
to determine the values at the failing point.
Step 8: ask which assumption failed
Example:
code assumes list has item 4

actual list:
2 items
Then ask:
Why did code assume
item 4 existed?
Step 9: reproduce with the smallest case
Reduce:
large production requestto:
one test input
that triggers failure
Step 10: form one concrete hypothesis
Good:
The parser assumes created_at
is always present, but the API
allows null.
Weak:
Something is wrong
with parsing.
Step 11: make the smallest correct fix
Fix the broken contract rather than merely suppressing the exception.
Step 12: run the failing case again
Confirm:
original failure no longer occursStep 13: test related cases
For a null-input bug:
valid value
null
empty value
malformed value
missing field
Step 14: add regression protection
The bug should become:
automated test
or
monitoring rule
or
stronger validation
where appropriate.
12. Avoid common stack-trace mistakes
Mistake: reading only the final printed line
The last line may be:
runtime worker entry pointrather than your failing code.
Mistake: fixing the first null check you see
A defensive check can hide corrupted state instead of correcting the contract that created it.
Mistake: ignoring the exception message
Developers sometimes jump directly to:
line 382while the runtime already says:
connection already closedMistake: ignoring nested causes
The outer:
ServiceErrormay hide:
PermissionDeniedMistake: assuming framework frames are useless
Framework frames can reveal:
which lifecycle callback
which middleware
which serializer
which scheduler
which database operation
was involved.
Mistake: assuming a dependency frame proves a dependency bug
Your code may have violated the dependency's documented input contract.
Mistake: debugging the wrong build
Verify:
release version
commit
build ID
feature flags
configuration
Mistake: truncating production traces
Error collectors should retain enough frames and cause information to make the report actionable.
Mistake: logging a trace without business context
This:
PaymentErroris much harder to investigate than a safely correlated:
operation:
payment_confirmation

payment_provider:
provider-a

request_id:
safe-correlation-id
Mistake: logging sensitive data
More diagnostic context is not always better if it exposes private or secret information.
13. Turn the fix into a regression test
Suppose production reports:
IndexError
at Cart.removeItem()
Investigation shows:
double tap
sends remove twice

first request:
removes item

second request:
uses old list index
Weak fix
catch IndexError
and ignore it
Stronger fix
make removal idempotent
or
disable duplicate action
or
remove by stable item ID
Add a regression test
Given:
cart contains item A

When:
remove A requested twice

Then:
system remains valid
and item is absent
Choose the lowest useful test level
If the bug is pure business logic:
unit testmay be enough.
If it requires:
database transaction
+
repository behavior
use an integration test.
If the defect depends on:
double tap
+
UI state
add an appropriate UI regression test.
Improve error messages when appropriate
If debugging required guessing because the original message said:
Invalid stateconsider changing it to:
Cannot remove cart item:
item ID 781 is not present
in current cart state
while avoiding sensitive values.
14. Copy/paste stack-trace debugging checklist
Stack trace debugging checklist

Initial capture
- Capture the complete error message.
- Capture the complete stack trace.
- Capture nested causes.
- Capture suppressed exceptions where available.
- Record application version.
- Record build ID.
- Record commit if available.
- Record environment.
- Record relevant runtime version.
- Record dependency version when relevant.

First read
- Identify exception / error type.
- Read the full message.
- Identify the failing operation.
- Determine stack-frame ordering.
- Identify the frame nearest the failure.
- Identify the outer entry point.
- Do not assume first printed frame is always root cause.
- Do not assume last printed frame is always root cause.

Stack anatomy
- Identify function / method.
- Identify class / namespace.
- Identify module / package.
- Identify source file.
- Identify line number.
- Identify column number where available.
- Identify native module where relevant.
- Identify thread / task where relevant.

Application boundary
- Mark application frames.
- Mark shared internal-library frames.
- Mark third-party frames.
- Mark runtime frames.
- Mark operating-system frames.
- Find nearest relevant application frame.
- Read several frames around that boundary.

Source inspection
- Open the exact source revision.
- Open the reported line.
- Read surrounding function.
- Read caller.
- Read called dependency.
- Check whether generated source differs from original source.
- Confirm line numbers match the exact build.

Exception message
- Identify expected state.
- Identify actual state.
- Extract safe identifiers.
- Look for invalid argument.
- Look for missing value.
- Look for permission failure.
- Look for timeout.
- Look for closed resource.
- Look for duplicate key.
- Look for malformed input.

Root cause
- Separate throw location from root cause.
- Ask which assumption failed.
- Ask where that assumption came from.
- Trace invalid value backward.
- Trace invalid state backward.
- Identify earliest incorrect state.
- Avoid adding defensive checks before understanding contract.

Null / nil failure
- Is null valid?
- Is null impossible by contract?
- Did deserialization produce null?
- Did database return null?
- Did race condition clear value?
- Did object initialize partially?
- Should model make field optional?
- Should caller validate earlier?
- Should UI handle missing value?

Index / bounds failure
- Record index.
- Record collection size.
- Check empty collection.
- Check stale index.
- Check concurrent modification.
- Check off-by-one.
- Check pagination.
- Prefer stable identifiers where appropriate.

Type failure
- Record expected type.
- Record actual type.
- Inspect deserialization.
- Inspect dynamic input.
- Inspect conversion.
- Check versioned payload.
- Check null.
- Validate boundary data earlier.

Parsing failure
- Capture exact safe input.
- Check empty value.
- Check null.
- Check whitespace.
- Check locale.
- Check decimal separator.
- Check date format.
- Check encoding.
- Check unsupported value.
- Add parser regression fixture.

Database failure
- Check query.
- Check parameters.
- Check connection state.
- Check transaction state.
- Check schema version.
- Check migration.
- Check uniqueness constraint.
- Check foreign-key constraint.
- Check timeout.
- Check deadlock.
- Check pool exhaustion.

Network failure
- Check hostname.
- Check DNS.
- Check timeout.
- Check TLS / certificate.
- Check authentication.
- Check status code.
- Check retry behavior.
- Check rate limit.
- Check proxy.
- Check malformed response.

File / I/O failure
- Check path.
- Check file existence.
- Check permissions.
- Check storage availability.
- Check working directory.
- Check encoding.
- Check resource packaging.
- Check concurrent access.
- Check disk-full condition.

Exception chains
- Read outer exception.
- Read inner exception.
- Read caused-by chain.
- Find deepest technical cause.
- Keep application context from outer layers.
- Do not assume deepest exception is complete root cause.
- Preserve original exception when wrapping.
- Avoid destroying stack information.

Wrapped errors
- Check whether wrapper changed message.
- Check whether original cause was retained.
- Check whether useful metadata survived.
- Avoid replacing detailed error with generic text.
- Add operation context without losing original cause.

Suppressed exceptions
- Identify primary failure.
- Identify cleanup failure.
- Do not let cleanup exception hide original failure.
- Inspect resource-close behavior.
- Inspect finally / defer / disposal code.

Async traces
- Identify async boundary.
- Identify await / promise / future.
- Identify callback.
- Identify task.
- Identify coroutine.
- Identify scheduler.
- Identify event-loop frame.
- Trace data crossing async boundary.
- Capture correlation ID.

Concurrency
- Identify failing thread.
- Capture other relevant threads.
- Check locks.
- Check shared state.
- Check task cancellation.
- Check object lifetime.
- Check use-after-close.
- Check concurrent mutation.
- Check race conditions.

Deadlock
- Capture all thread stacks.
- Identify waiting threads.
- Identify held locks.
- Build lock dependency chain.
- Check inconsistent lock order.
- Check blocking I/O inside locks.
- Check callbacks while holding locks.

Recursion
- Look for repeating frame.
- Look for repeating frame group.
- Identify base condition.
- Check input decreases toward base condition.
- Check cyclic graph.
- Check recursive serialization.
- Check mutual recursion.
- Check accidental event recursion.

Callbacks
- Identify callback registration.
- Identify callback invocation.
- Check object still alive.
- Check state changed before callback.
- Check callback invoked twice.
- Check error callback.
- Check cancellation path.

Framework frames
- Do not ignore automatically.
- Identify lifecycle callback.
- Identify middleware.
- Identify router.
- Identify serializer.
- Identify database abstraction.
- Identify rendering framework.
- Identify scheduler.
- Find application entry into framework.

Dependency frames
- Confirm dependency version.
- Validate application inputs.
- Check documented contract.
- Search known issue when appropriate.
- Reproduce with minimal dependency usage.
- Test upgrade / downgrade if evidence supports it.
- Avoid blaming dependency without evidence.

Production traces
- Verify exact application version.
- Verify exact build.
- Verify exact environment.
- Retrieve correct symbols.
- Retrieve correct mapping file.
- Retrieve correct source maps.
- Keep artifacts by release.
- Do not decode with mismatched build artifacts.

Source maps
- Keep generated source map.
- Associate map with release.
- Upload to error-monitoring system where appropriate.
- Protect source artifacts where needed.
- Confirm mapped line belongs to correct commit.
- Test source-map pipeline before production incident.

Obfuscation
- Keep mapping artifact.
- Record build ID.
- Deobfuscate before investigation.
- Avoid manually guessing short function names.
- Preserve mappings according to release-retention policy.

Native crashes
- Capture crash report.
- Capture module identifiers.
- Retrieve matching debug symbols.
- Symbolicate addresses.
- Inspect crashing thread.
- Inspect exception / signal type.
- Inspect registers only when relevant.
- Check native-library version.

Logging context
- Capture timestamp.
- Capture safe request ID.
- Capture operation name.
- Capture route / endpoint.
- Capture app version.
- Capture feature flags.
- Capture deployment.
- Capture thread / task.
- Avoid secrets.

Privacy
- Do not log passwords.
- Do not log access tokens.
- Do not log refresh tokens.
- Do not log API keys.
- Do not log private database credentials.
- Minimize personal data.
- Redact sensitive payload fields.
- Review crash-report privacy.

Reproduction
- Write exact steps.
- Use same build.
- Use same configuration.
- Use same input shape.
- Reproduce locally.
- Reduce to smallest case.
- Remove unrelated actions.
- Repeat several times.

Debugger
- Set breakpoint before failing line.
- Inspect parameters.
- Inspect local variables.
- Inspect object state.
- Inspect collection sizes.
- Inspect relevant globals.
- Inspect thread.
- Step into relevant call.
- Step out of framework noise when appropriate.

Hypothesis
- Write one specific hypothesis.
- State expected condition.
- State observed condition.
- State proposed cause.
- Define a test that can falsify hypothesis.
- Avoid changing code before hypothesis where possible.

Example hypothesis
- Parser expects date.
- API may return null.
- Null reaches parser.
- Parser throws.
- Test fixture with null should reproduce.
- If it reproduces, contract handling is incomplete.

Fix
- Fix violated contract.
- Validate at system boundary.
- Handle legitimate optional state.
- Avoid hiding corruption.
- Avoid catch-and-ignore unless explicitly safe.
- Keep change focused.
- Preserve useful error information.

Validation
- Run original failing input.
- Confirm stack trace disappears.
- Confirm desired behavior.
- Test related edge cases.
- Test success case.
- Test malformed case.
- Test null / empty case where relevant.
- Test concurrency case where relevant.

Regression test
- Use lowest effective level.
- Add unit test for logic bug.
- Add integration test for boundary bug.
- Add UI test for interaction bug.
- Add E2E only when full-system behavior is required.
- Name test after failure condition.
- Keep reproduction fixture.

Observability
- Improve error message.
- Add safe operation context.
- Add correlation ID.
- Track occurrence count.
- Track affected version.
- Track affected endpoint / feature.
- Avoid noisy duplicate logging.

Error messages
- State what failed.
- State expected value.
- State safe actual value or category.
- Add operation context.
- Avoid generic "something failed".
- Avoid leaking secrets.
- Preserve original cause.

Monitoring
- Group equivalent failures.
- Separate releases.
- Detect regression after deployment.
- Track first seen.
- Track last seen.
- Track occurrence volume.
- Track affected environments.
- Alert based on impact.

Common mistakes
- Do not read one frame only.
- Do not stop at wrapper exception.
- Do not assume dependency is broken.
- Do not patch null blindly.
- Do not debug wrong build.
- Do not ignore async boundaries.
- Do not ignore thread context.
- Do not truncate causes.
- Do not expose secrets.

Final review
- What exact error occurred?
- What does the message say?
- Which frame is closest to failure?
- Which frame first enters my code?
- Are there nested causes?
- Are there async boundaries?
- Is recursion visible?
- Is concurrency involved?
- Is the trace symbolicated correctly?
- Am I looking at the exact source revision?
- What input reached the failing line?
- Which assumption was false?
- Where was that incorrect state created?
- Can I reproduce it minimally?
- Does my fix repair the contract rather than hide the symptom?
- Does the original failing case now pass?
- Is there a regression test?
- Would the next occurrence produce better diagnostic context?
15. FAQ
What is a stack trace?
A stack trace is a representation of the sequence of function or method calls associated with a particular execution point, most commonly when a runtime error or exception occurs.
Should I read a stack trace from top to bottom?
Not as a universal rule. Trace formats differ between runtimes. First identify the exception message and the frame closest to the failure, then follow callers outward and look for the nearest relevant application frame.
Is the first application frame always the bug?
No. It is often a useful investigation starting point, but the invalid state may have been created earlier. Inspect the inputs and assumptions leading into that frame.
What does "caused by" mean?
It typically indicates that one exception was wrapped inside another. Read both levels: the outer exception supplies higher-level context while the inner cause often identifies the lower-level failure.
Why do async stack traces look incomplete?
Asynchronous execution can resume later through an event loop, scheduler, promise, future, callback, or coroutine. The original synchronous stack may no longer exist, so runtimes either reconstruct the logical chain or show an explicit async boundary.
Why does a production trace show meaningless function names?
Production code may be bundled, minified, obfuscated, optimized, or stripped of symbols. The correct source maps, deobfuscation mappings, or debug symbols for that exact build are needed to reconstruct useful names and locations.
Should I always catch an exception to stop the crash?
No. Catching an exception without understanding or safely handling the underlying failure can hide corrupted state and make diagnosis harder. Catch only where the program has a meaningful recovery, translation, or cleanup strategy.
Key terms (quick glossary)
- Call stack
- Runtime bookkeeping representing active function or method calls and the order in which control should return.
- Stack trace
- A printed or captured representation of stack frames associated with a particular point in program execution.
- Stack frame
- One entry in the call stack, typically associated with a function, method, source location, return point, and execution context.
- Exception
- A structured runtime signal representing an error or exceptional condition that can often propagate through function calls.
- Root cause
- The earliest meaningful defect, invalid assumption, configuration error, input, race, or external condition that ultimately caused the observed failure.
- Application frame
- A stack frame belonging to source code controlled by the application team rather than a third-party framework or runtime.
- Exception chain
- A relationship between multiple exceptions where one failure is wrapped or recorded as the cause of another.
- Async boundary
- A transition where execution is suspended or scheduled and later resumes outside the original synchronous call stack.
- Symbolication
- Translating native instruction addresses or offsets into readable function names, files, and line numbers using matching debug symbols.
- Source map
- Metadata mapping generated or bundled code locations back to the original source files and locations.
- Obfuscation mapping
- Metadata used to translate shortened or transformed production class and function names back to their original identifiers.
- Regression test
- An automated test added or maintained to verify that a previously fixed defect does not reappear.
- Breakpoint
- A debugger instruction that pauses execution at a selected location so runtime state can be inspected.
- Correlation ID
- A safe identifier used to connect logs, traces, requests, or asynchronous operations belonging to the same logical activity.
- Stack overflow
- A runtime failure that can occur when call-stack usage exceeds the available limit, commonly because of uncontrolled recursion.
- Suppressed exception
- An additional exception retained alongside a primary exception, often because another failure occurred during resource cleanup.
Worth reading
Recommended guides from the category.