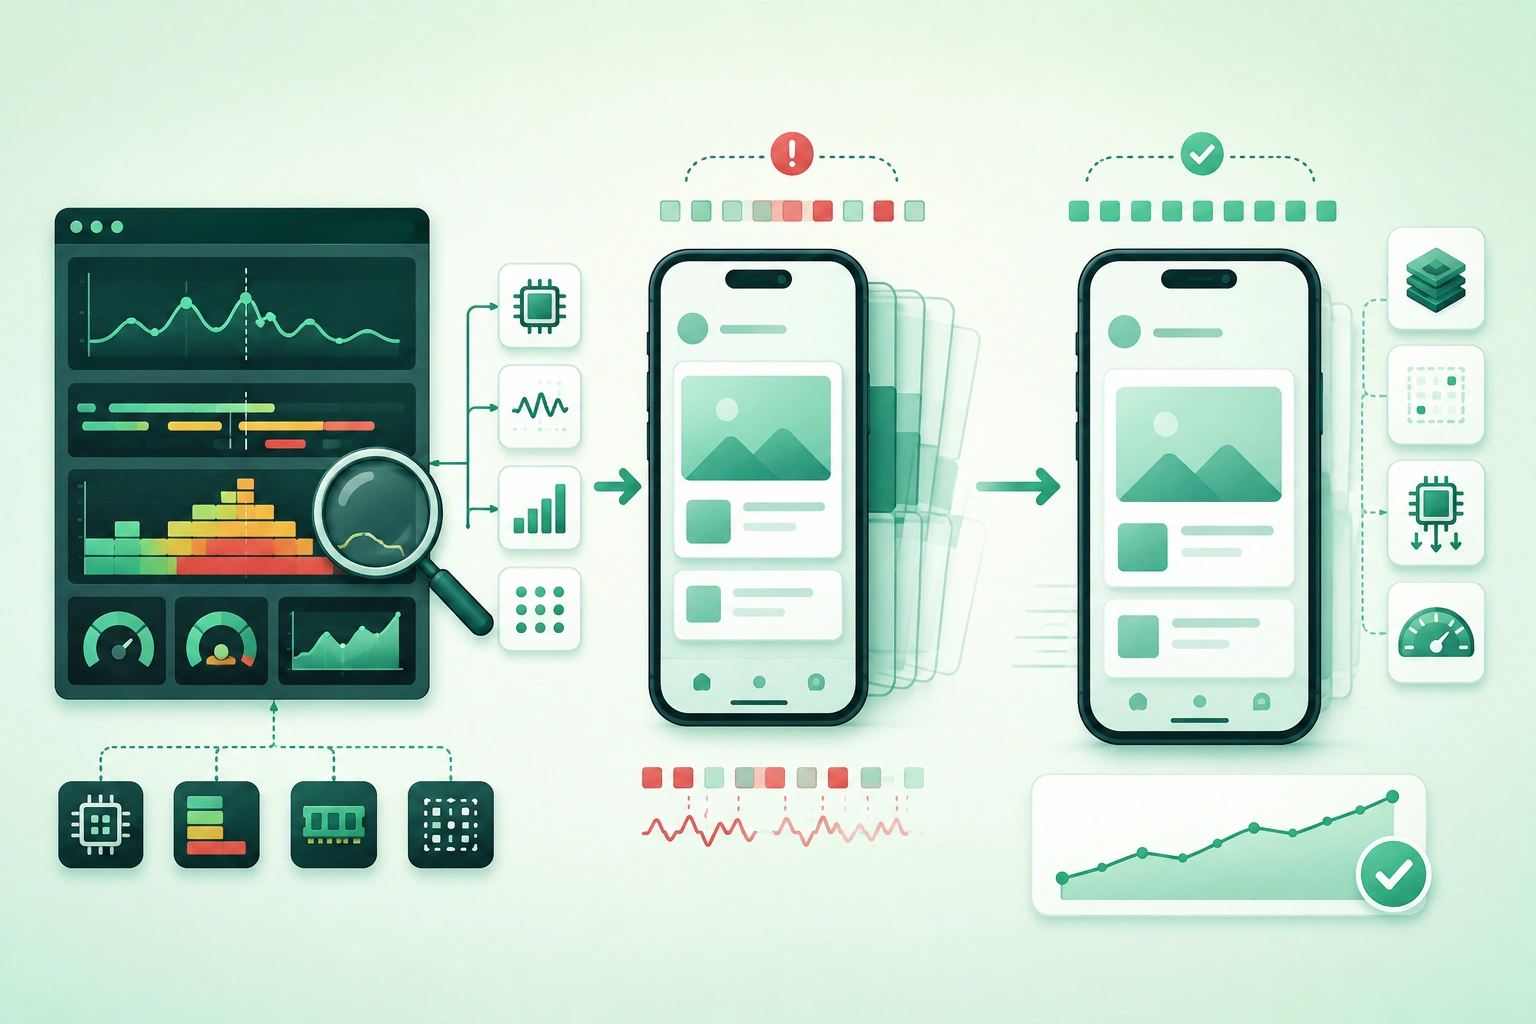
A mobile application can have:
low average CPU usage
plenty of free memory
fast API responses
and still feel slow.
Users experience performance through moments:
scroll
tap
animation
navigation
keyboard appearance
list update
image load
If one critical frame arrives too late, the interface can visibly stutter.
That is why performance work should begin with:
which interaction is janky?rather than:
which function looks inefficient?Profile first, optimize second
Performance bugs are easy to misdiagnose. A slow-looking animation may be blocked by database I/O, image decoding, layout work, garbage collection, a lock held by background code, or GPU rendering. Capture a trace around the actual stutter before rewriting architecture.
1. Understand what UI jank actually means
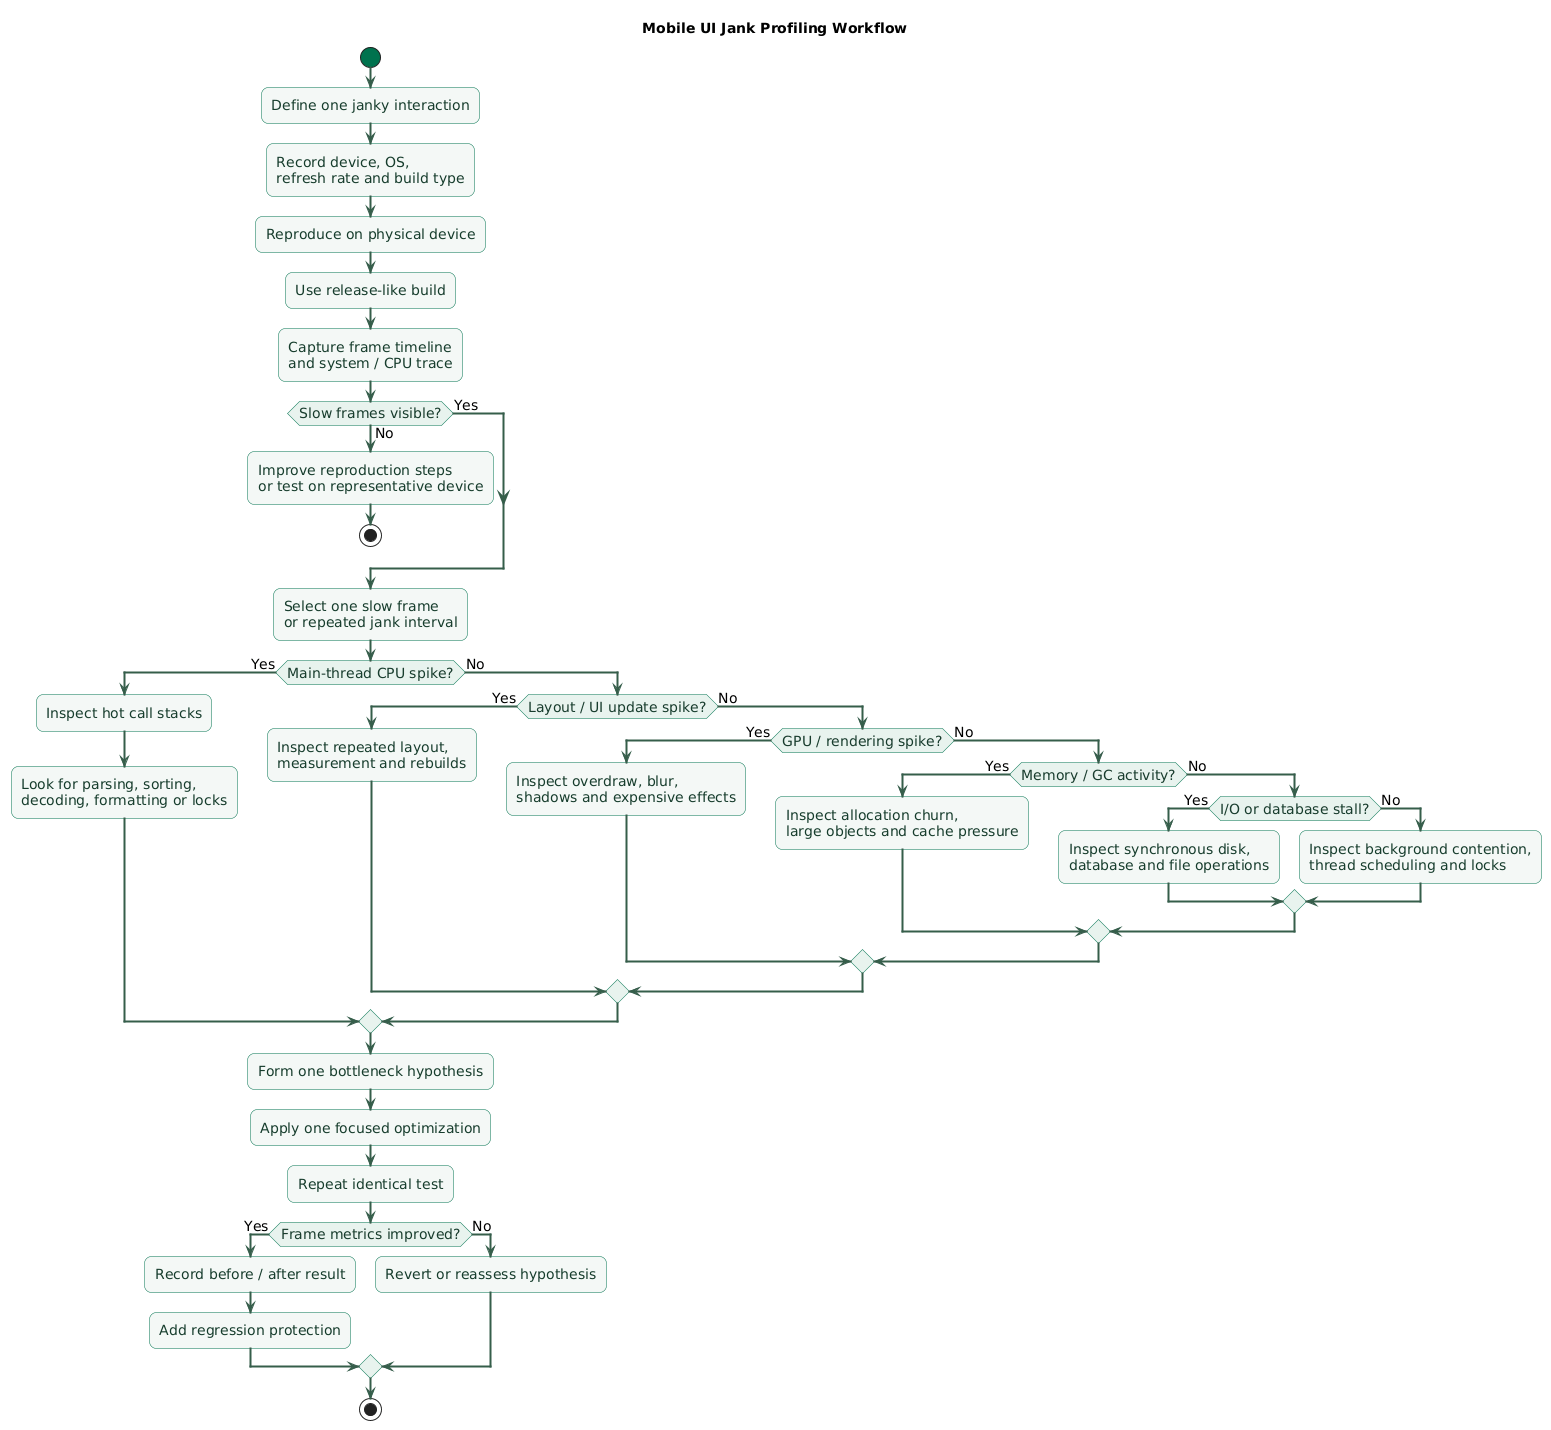
Mobile UI jank profiling workflow (diagram)
The display refreshes on a schedule.
At 60 Hz:
1000 ms / 60
≈
16.7 ms per refresh interval
At 120 Hz:
1000 ms / 120
≈
8.3 ms per refresh interval
The application does not necessarily own every millisecond of that interval because the operating system and graphics pipeline also perform work.
A missed deadline becomes visible
Frame A:
ready on time

Frame B:
takes too long

display:
repeats previous frame

result:
visible stutter
Jank is about consistency
Compare:
10 ms
11 ms
10 ms
12 ms
11 ms
with:
7 ms
7 ms
42 ms
8 ms
7 ms
The second sequence may have a similar average but a much worse user experience.
Common jank symptoms
- Scrolling pauses.
- Animations skip.
- Gestures feel delayed.
- Navigation freezes briefly.
- Keyboard transitions hitch.
- Lists jump when content loads.
2. Create a reproducible performance scenario
Good profiling needs a narrow scenario.
Bad target
the app feels slow sometimesGood target
Open product list
scroll quickly for 5 seconds
tap product 20
return
repeat 3 times
Control the test environment
Record:
device model
OS version
build type
data volume
network condition
battery / thermal condition
refresh rate
Use a representative device
A flagship development phone may hide:
- CPU bottlenecks.
- Memory pressure.
- Slow storage.
- Expensive image decoding.
Profile at least one device representative of the lower end of your actual supported population.
Use release-like builds for conclusions
Debug builds can include:
- Extra logging.
- Debug assertions.
- Instrumentation.
- Reduced compiler optimization.
Debug traces are useful, but validate important findings in a release-like configuration.
3. Think in frame budgets, not average CPU
Mobile frame budget and jank causes (diagram)
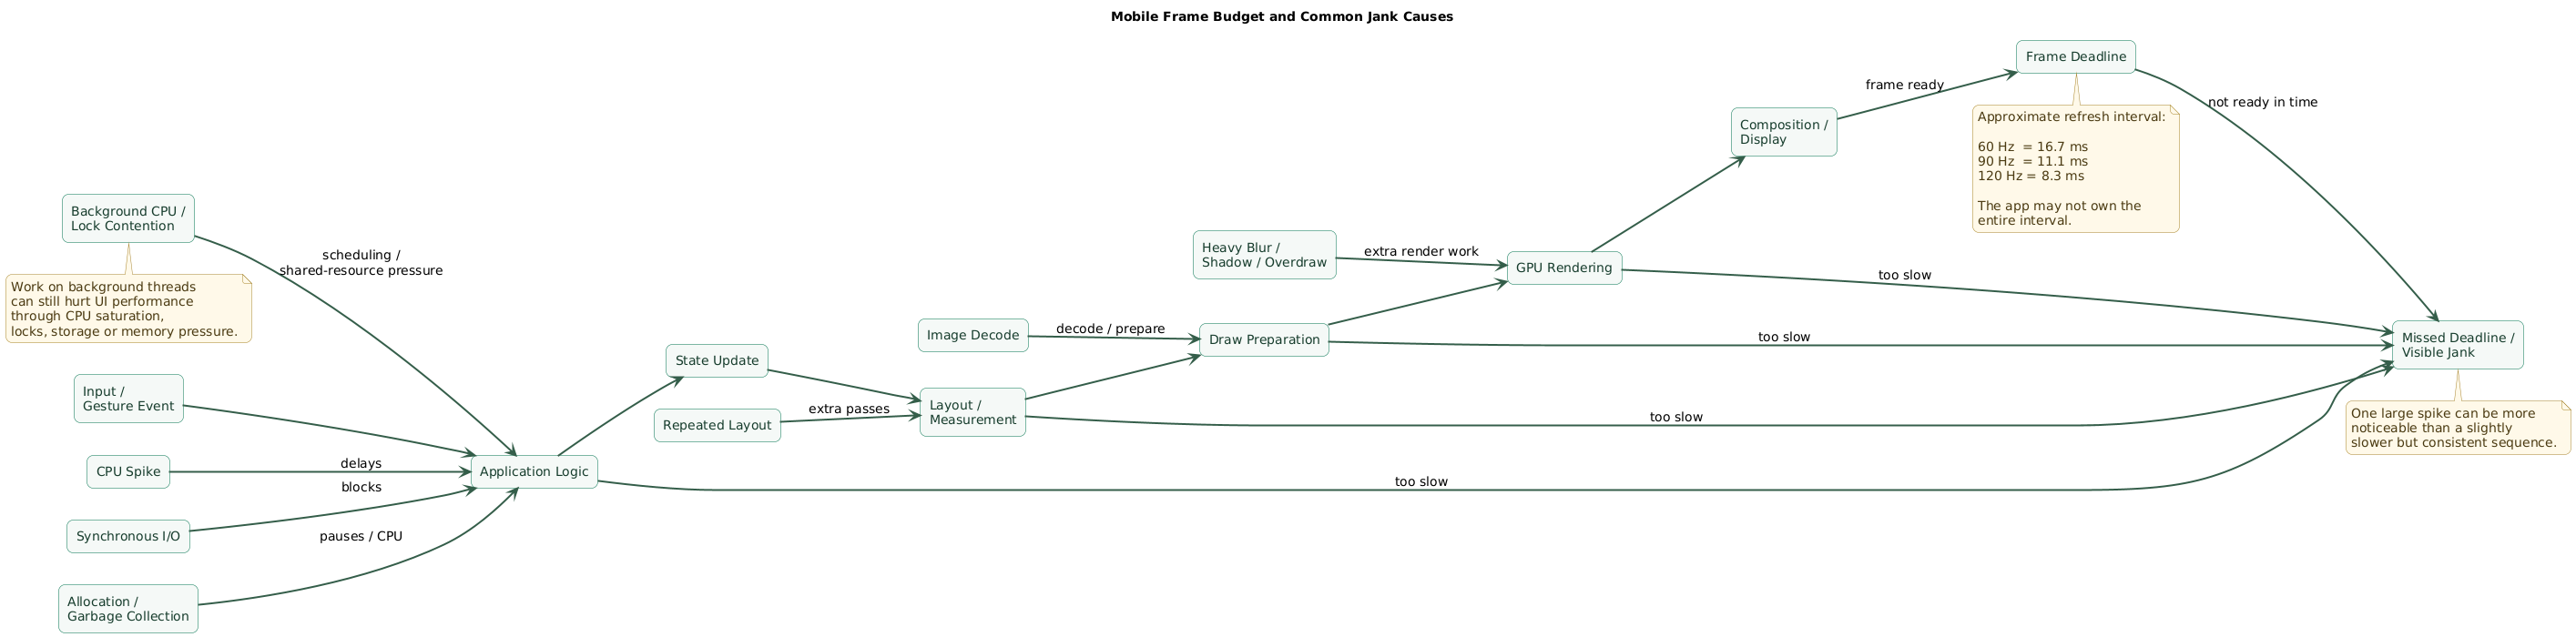
A simplified frame can involve:
input
   ↓
application state update
   ↓
layout / measurement
   ↓
drawing preparation
   ↓
GPU rendering
   ↓
composition
   ↓
display
If any part delays the pipeline, the frame can miss its deadline.
CPU bottleneck
UI thread:
42 ms
while the GPU finishes quickly.
GPU bottleneck
CPU:
5 ms

GPU:
24 ms
can still miss the frame.
Resource contention
Background work may consume:
CPU
storage
memory bandwidth
locks
and indirectly delay UI work.
Do not optimize the wrong stage
Reducing layout time from:
2 ms
to
1 ms
does little if the frame contains:
45 ms synchronous database query4. Find main-thread blocking work
One of the most common causes of jank is doing too much work on the thread responsible for UI responsiveness.
Suspicious work includes
- JSON parsing.
- Image decoding.
- Database queries.
- File reads.
- Large sorting operations.
- Expensive object mapping.
- Cryptographic work.
Profile the slow frame
Look for a timeline such as:
tap
 ↓
navigation
 ↓
main thread:
parse 22 ms
layout 11 ms
image decode 18 ms
Move eligible work away from the UI path
Instead of:
tap
 ↓
read file
 ↓
parse JSON
 ↓
navigate
prefer:
prepare data earlier

or

perform expensive work
asynchronously

then publish small UI update
Background threads are not automatically safe
You can create jank by:
launching 20 CPU-heavy workersthat compete with the UI thread for CPU time.
Watch locks
UI thread
waits for mutex

background worker
holds mutex while doing I/O
is still a UI-thread stall.
5. Reduce excessive layout and UI updates
Layout can become expensive when the view hierarchy is large or updated repeatedly.
Typical pattern
state change
 ↓
layout

state change
 ↓
layout

state change
 ↓
layout
all during one interaction.
Batch related state changes
Prefer:
prepare new state
      ↓
single UI update
Remove unnecessary nesting
A deeply nested layout can increase:
- Measurement.
- Constraint solving.
- Invalidation.
- Drawing work.
Watch broad state observation
If changing:
cart countcauses:
entire page
+
header
+
product grid
+
recommendations
to rebuild, the state boundaries may be too broad.
Measure before flattening everything
Modern UI frameworks already optimize many layout operations.
Simplify the actual hot path revealed in the profiler rather than mechanically reducing every container.
6. Profile image decoding and rendering
Images cause jank through both CPU and memory.
Oversized source
4000 x 4000 image

displayed at

300 x 300
can waste decoding work and memory.
Decode near the required size
Use image-loading pipelines that can:
- Resize.
- Cache.
- Decode asynchronously.
- Cancel obsolete requests.
Avoid decoding during scroll
Bad:
cell becomes visible
      ↓
decode huge image
on main thread
Cache carefully
An unlimited image cache can solve CPU problems and create:
memory pressure
      ↓
eviction
      ↓
redecode
      ↓
more jank
Use bounded caching appropriate to device resources.
7. Investigate GPU and drawing bottlenecks
Not every slow frame is caused by application CPU code.
GPU-heavy UI can include
- Large blur effects.
- Multiple translucent layers.
- Heavy shadows.
- Complex masks.
- Large animated gradients.
- Expensive custom drawing.
Overdraw
Consider:
background
drawn

then
opaque card
covers it

then
another opaque layer
covers that
Pixels may be rendered several times.
Off-screen rendering
Certain effects can require intermediate surfaces.
These may increase:
GPU memory
render passes
composition cost
Reduce complexity where users cannot see the difference
A large blur radius or elaborate shadow may cost substantially more while producing almost no visible benefit on a small phone screen.
Do not remove all effects blindly
Use GPU-related profiling information to identify expensive regions before changing visual design.
8. Look for allocation churn and memory pressure
Jank can appear when interaction repeatedly allocates temporary objects.
Example
scroll event
 ↓
allocate objects
 ↓
allocate more
 ↓
garbage collection
 ↓
pause / CPU spike
Look for allocation rate
A steady memory footprint does not mean allocation behavior is healthy.
You can allocate:
100 MB

then free 100 MB

then allocate 100 MB again
while long-term memory remains roughly flat.
Common allocation sources
- String formatting.
- Temporary collections.
- Repeated JSON conversion.
- Bitmap creation.
- UI model rebuilding.
Do not introduce unsafe object pools by default
First remove unnecessary work and reuse naturally reusable structures.
Complex manual pooling can increase bugs and memory retention.
Memory pressure affects the whole app
High memory use can trigger:
- Cache eviction.
- More decoding.
- More garbage collection.
- System pressure.
9. Remove synchronous I/O from interactions
Storage operations are unpredictable enough that they should be treated carefully on latency-sensitive UI paths.
Bad interaction
user taps row
      ↓
synchronous database query
      ↓
read file
      ↓
open next screen
Better
user taps row
      ↓
navigate immediately
      ↓
load required data asynchronously
      ↓
update screen
when the product permits it.
Prefetch predictable data
If the user is scrolling toward:
items 40-50you may be able to prefetch content before it becomes visible.
Database work
Look for:
- Missing indexes.
- Huge result sets.
- N+1 query patterns.
- Repeated deserialization.
Network callbacks can cause local jank too
The network request itself may be asynchronous, but processing:
10,000 response objectson the UI thread can still freeze the interface.
10. Optimize scrolling lists and large UI trees
Scrolling is where users notice inconsistent frames immediately.
Virtualize
Do not create:
5,000 full item viewswhen only:
10-20are visible.
Use stable identities
Incorrect or unstable keys can cause:
unnecessary item recreation
animations
layout
state loss
Keep item rendering cheap
Avoid per-item:
- Heavy parsing.
- Database queries.
- Large image decoding.
- Expensive synchronous formatting.
Precompute expensive display values
If formatting:
date
currency
rich text
derived statistics
is expensive and stable, compute it outside the critical scroll path.
Load incrementally
Instead of:
load 20,000 database rows
into memory
use pagination or windowed loading where appropriate.
11. Use Android and iOS profiling tools systematically
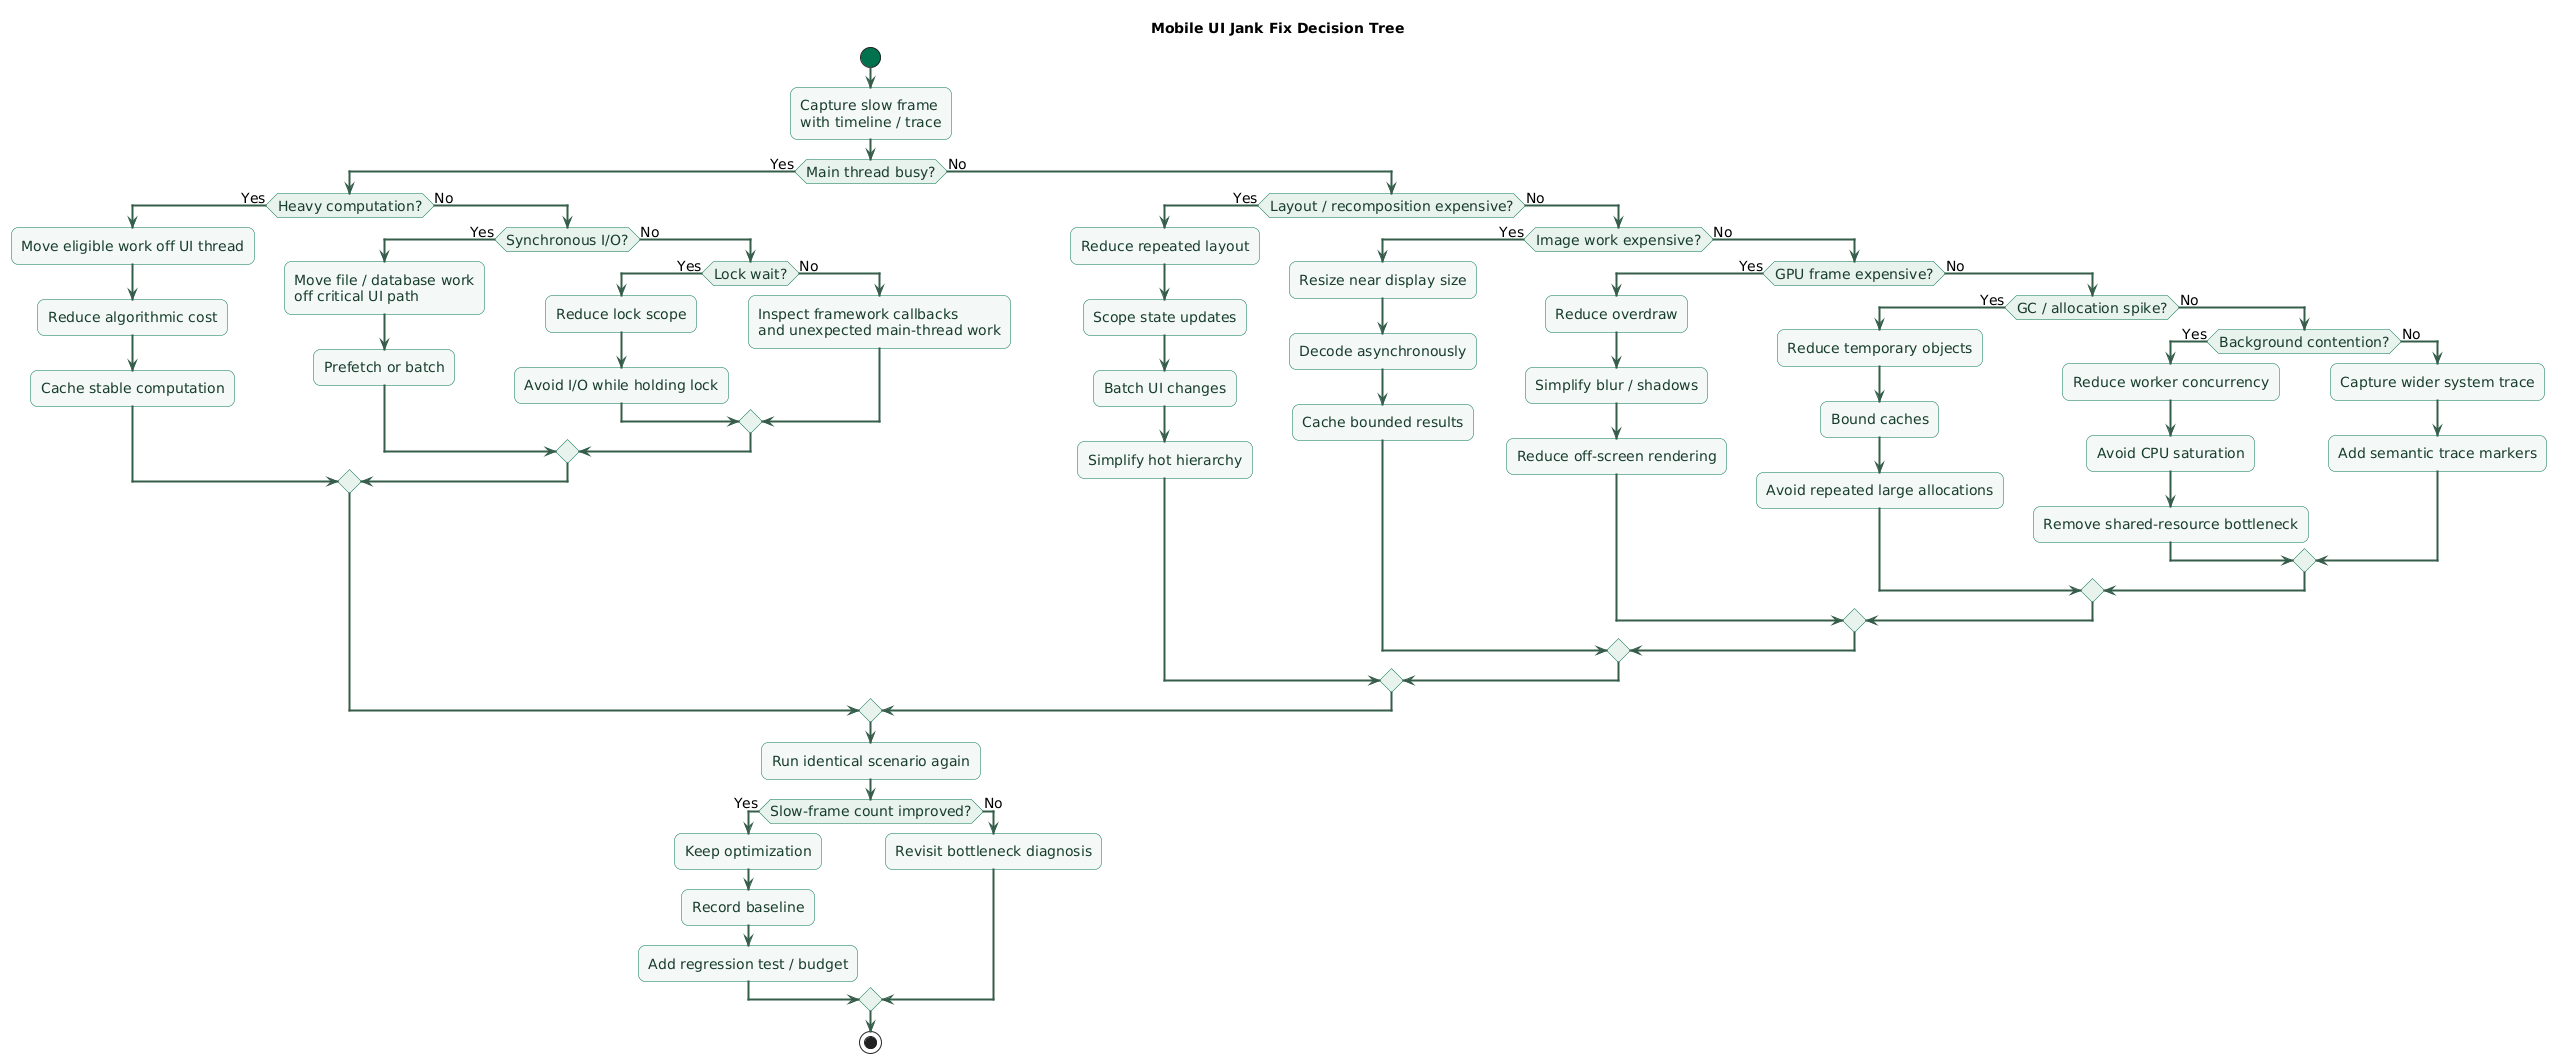
Mobile UI jank fix decision tree (diagram)
Android
Useful profiling views and traces can expose:
frame timing
CPU execution
thread scheduling
memory allocation
system events
rendering work
System traces are especially valuable when the cause spans:
application thread
+
OS scheduling
+
rendering pipeline
Add trace markers
Instead of a trace containing only framework method names, add semantic regions such as:
LoadProductFeed

MapApiResponse

BindVisibleItems

DecodeHeroImage
This makes performance traces easier to interpret.
iOS
Instruments can help investigate:
- CPU hotspots.
- Animation and rendering behavior.
- Memory allocation.
- Leaks.
- System activity.
Use signposts for application-level phases
Mark:
SearchRequested

ResultsDecoded

ResultsApplied

TransitionStarted

TransitionCompleted
so system traces can be connected to product behavior.
Sample profilers answer “where is CPU time going?”
They are especially useful when a slow frame contains a large CPU spike.
Look for:
hot call stacks

repeated expensive methods

unexpected framework callbacks
Timeline profilers answer “what happened together?”
They are better when you need to connect:
input
thread scheduling
database work
rendering
frame miss
12. Fix one bottleneck and measure again
Performance optimization should behave like an experiment.
Baseline
test:
scroll product list

slow frames:
18

worst frame:
61 ms
Hypothesis
image decoding blocks
visible-item rendering
Change
resize images
+
decode asynchronously
+
cache decoded result
Measure again
slow frames:
6

worst frame:
27 ms
That is evidence of improvement.
Do not combine ten unrelated changes first
If you simultaneously:
change database
rewrite list
replace image loader
change navigation
remove animations
you cannot easily tell what solved the problem.
Watch for tradeoffs
A performance fix can increase:
- Memory.
- Battery consumption.
- Network traffic.
- Code complexity.
Example:
cache everything
=
fast UI

but

huge memory footprint
Optimize the overall system.
13. Prevent performance regressions
A smooth release can become janky one feature at a time.
Create interaction budgets
Track representative flows:
startup

feed scroll

open details

search typing

checkout transition
Store baseline metrics
version
device
slow-frame count
worst frame
startup duration
memory peak
Automate what can be automated
UI performance tests can repeatedly run important journeys and detect large regressions before release.
Keep physical-device coverage
Simulators and emulators are useful for development, but graphics, scheduling, thermal behavior and storage performance can differ from real hardware.
Profile new SDKs
A new:
analytics SDK
advertising SDK
image library
database layer
can introduce:
- Startup work.
- Main-thread initialization.
- Background contention.
- Memory growth.
Compare before and after releases
Performance monitoring should answer:
Did version 4.8
become slower than 4.7?
rather than waiting for users to describe it in reviews.
14. Copy/paste UI-jank profiling checklist
Mobile UI jank profiling checklist

Problem definition
- Identify exact janky interaction.
- Record expected behavior.
- Record visible symptom.
- Define reproducible steps.
- Avoid vague "app feels slow" reports.
- Capture video if useful.
- Record affected screens.

Test environment
- Record device model.
- Record OS version.
- Record app version.
- Record build type.
- Record refresh rate.
- Record data volume.
- Record network state.
- Record thermal state where relevant.
- Use physical device.
- Include representative slower device.

Build
- Reproduce in debug if necessary.
- Validate in release-like build.
- Disable unnecessary debug logging.
- Keep production-like optimization.
- Use same data for comparisons.

Frame timing
- Capture frame timeline.
- Identify slow frames.
- Identify repeated slow-frame pattern.
- Record worst frame.
- Record slow-frame count.
- Record interaction duration.
- Compare refresh-rate requirements.
- Do not optimize from average FPS alone.

Frame budget
- Understand display refresh interval.
- Do not assume 16.7 ms on every device.
- Identify CPU portion.
- Identify rendering portion.
- Identify scheduling gaps.
- Identify frame deadline miss.
- Correlate user action with frame miss.

Main thread
- Inspect main-thread call stacks.
- Look for parsing.
- Look for sorting.
- Look for image decoding.
- Look for database work.
- Look for file I/O.
- Look for cryptography.
- Look for logging.
- Look for synchronous network preparation.
- Look for lock waits.

Background work
- Inspect worker threads.
- Look for CPU saturation.
- Look for excessive parallelism.
- Look for lock contention.
- Look for storage contention.
- Look for memory bandwidth pressure.
- Limit unnecessary worker concurrency.

Locks
- Identify UI-thread waiting.
- Identify lock owner.
- Measure lock duration.
- Avoid I/O while holding shared lock.
- Narrow lock scope.
- Avoid unnecessary global synchronization.

Layout
- Measure layout time.
- Look for repeated layout passes.
- Look for large hierarchies.
- Look for redundant measurement.
- Batch state changes.
- Reduce unnecessary invalidations.
- Avoid rebuilding entire screen for small state changes.
- Simplify hot layout paths.

Declarative UI
- Inspect unnecessary recomposition or rebuilds.
- Use stable state identities.
- Scope state observation narrowly.
- Avoid expensive work inside render functions.
- Precompute expensive values.
- Keep side effects outside rendering.
- Measure before adding memoization everywhere.

Images
- Check image dimensions.
- Check decoded size.
- Resize near display dimensions.
- Decode off main thread.
- Cache appropriately.
- Cancel obsolete requests.
- Avoid decoding during fast scroll.
- Avoid unlimited memory cache.
- Test low-memory behavior.

GPU
- Inspect rendering timeline.
- Look for overdraw.
- Look for large translucent surfaces.
- Look for blur.
- Look for shadows.
- Look for clipping.
- Look for masks.
- Look for expensive custom drawing.
- Reduce invisible visual complexity.
- Test animations separately.

Animations
- Keep per-frame work small.
- Avoid allocating per frame.
- Avoid synchronous data loading during animation.
- Avoid repeatedly rebuilding large hierarchy.
- Precompute paths where useful.
- Test on high-refresh displays.
- Test interrupted animations.
- Measure transition start and end.

Memory
- Measure memory usage.
- Measure allocation rate.
- Look for temporary object churn.
- Look for bitmap growth.
- Look for cache growth.
- Look for leaks.
- Look for repeated large allocations.
- Correlate garbage collection with slow frames.
- Test memory pressure.

Allocation
- Reduce unnecessary temporary collections.
- Avoid repeated string construction.
- Avoid repeated conversion objects.
- Reuse naturally reusable buffers where safe.
- Avoid premature complex pooling.
- Verify optimization with allocation profiler.

Database
- Remove main-thread queries.
- Check indexes.
- Limit result size.
- Avoid N+1 queries.
- Avoid repeated deserialization.
- Use pagination where appropriate.
- Cache stable results carefully.
- Measure query duration.

Disk I/O
- Avoid synchronous file reads during interaction.
- Avoid synchronous writes during animation.
- Batch writes where appropriate.
- Move non-urgent persistence off critical path.
- Measure slow-storage device.
- Avoid unnecessary filesystem scanning.

Networking
- Keep requests asynchronous.
- Do not parse large responses on UI thread.
- Avoid applying thousands of UI updates individually.
- Batch result application.
- Cache where appropriate.
- Handle partial data progressively.

Lists
- Use virtualization.
- Use stable item IDs.
- Avoid expensive item rendering.
- Avoid per-item database query.
- Avoid per-item network call.
- Precompute display models.
- Paginate large datasets.
- Cancel off-screen image requests.
- Avoid unnecessary item animations.

Navigation
- Measure tap-to-first-frame.
- Avoid synchronous preparation.
- Preload predictable data.
- Preserve responsive transition.
- Delay non-critical work.
- Avoid heavy initialization on destination main thread.

Startup
- Separate cold and warm startup.
- Measure startup timeline.
- Identify SDK initialization.
- Defer non-critical initialization.
- Avoid loading entire database immediately.
- Avoid synchronous network initialization.
- Keep first interactive screen small.

Android profiling
- Capture frame timing.
- Capture CPU profile.
- Capture system trace.
- Inspect thread scheduling.
- Inspect memory allocation.
- Inspect rendering events.
- Add application trace sections.
- Profile release-like build.
- Compare representative devices.

Android traces
- Mark product interactions.
- Mark repository calls.
- Mark parsing.
- Mark image decode.
- Mark state application.
- Mark navigation.
- Keep markers semantic.
- Avoid excessive trace overhead.

iOS profiling
- Use Instruments.
- Inspect Time Profiler.
- Inspect rendering / animation behavior.
- Inspect allocations.
- Inspect leaks.
- Inspect system activity.
- Use release configuration where practical.
- Test on physical device.

iOS signposts
- Add semantic intervals.
- Mark user action.
- Mark data fetch completion.
- Mark decoding.
- Mark state update.
- Mark transition.
- Keep production-safe instrumentation where useful.

CPU profile
- Find hottest stacks.
- Separate self time from child time.
- Identify repeated calls.
- Identify unexpected callbacks.
- Identify one-frame spikes.
- Avoid optimizing cold code.
- Confirm hot path belongs to janky interaction.

Timeline
- Correlate input.
- Correlate scheduling.
- Correlate I/O.
- Correlate CPU work.
- Correlate rendering.
- Correlate garbage collection.
- Correlate frame deadline miss.

Custom metrics
- Add tap-to-render metric.
- Add screen-ready metric.
- Add list-scroll metric.
- Add startup metric.
- Track per version.
- Track per device class.
- Avoid sensitive data in traces.

Fix strategy
- Choose largest bottleneck.
- Write hypothesis.
- Make one focused change.
- Run identical scenario.
- Compare trace.
- Compare frame metrics.
- Check memory.
- Check battery side effects.
- Keep change only if evidence supports it.

CPU fix
- Move eligible work off UI thread.
- Reduce algorithmic complexity.
- Cache stable computation.
- Batch repeated work.
- Avoid unnecessary parsing.
- Avoid unnecessary formatting.
- Reduce redundant state updates.

Layout fix
- Reduce repeated measurement.
- Reduce unnecessary nesting where hot.
- Scope state.
- Batch updates.
- Keep list cells simple.
- Avoid size changes during scroll where unnecessary.
- Precompute stable dimensions where appropriate.

GPU fix
- Reduce overdraw.
- Reduce transparent layers.
- Simplify blur.
- Simplify shadow.
- Reduce giant off-screen surfaces.
- Reduce unnecessary clipping.
- Optimize custom shaders.
- Test visual quality after changes.

Memory fix
- Reduce oversized images.
- Bound caches.
- Remove leaks.
- Reduce allocation churn.
- Reuse buffers safely.
- Avoid holding invisible screens unnecessarily.
- Respond to memory pressure.

I/O fix
- Make disk access asynchronous.
- Add database indexes.
- Batch writes.
- Prefetch.
- Paginate.
- Cache stable data.
- Avoid scanning large directories in UI path.

Background contention fix
- Reduce worker concurrency.
- Prioritize UI-sensitive work.
- Avoid CPU saturation.
- Avoid large background compression during interaction.
- Avoid holding locks.
- Schedule non-urgent work later.

Validation
- Repeat same scenario.
- Repeat several times.
- Ignore one lucky run.
- Compare median and tail behavior.
- Compare worst frames.
- Compare slow-frame count.
- Test slower device.
- Test high-refresh device.
- Check visual correctness.

Tradeoffs
- Measure memory after caching.
- Measure battery after prefetching.
- Measure network usage.
- Measure startup impact.
- Keep code maintainable.
- Avoid optimization that creates correctness bugs.

Regression testing
- Define performance budgets.
- Store baselines.
- Track startup.
- Track key interactions.
- Track slow frames.
- Run representative journeys.
- Compare releases.
- Alert on major regressions.

Dependencies
- Profile new SDKs.
- Watch main-thread initialization.
- Watch startup hooks.
- Watch background threads.
- Watch memory.
- Watch binary size.
- Remove unnecessary SDKs.

Production monitoring
- Collect privacy-safe performance metrics.
- Track slow interactions.
- Track device class.
- Track app version.
- Detect release regressions.
- Avoid logging sensitive user content.

Final review
- Can I reproduce the jank?
- Is the test on representative hardware?
- Am I profiling a release-like build?
- Which exact frames are slow?
- Is the bottleneck CPU, layout, GPU, memory, I/O, or contention?
- Is the UI thread blocked?
- Are locks involved?
- Is image decoding involved?
- Is synchronous database work involved?
- Is garbage collection correlated?
- Is background work competing for resources?
- Is list virtualization working?
- Are state updates too broad?
- Are visual effects expensive?
- Did I make one focused optimization?
- Did the trace improve afterward?
- Did memory or battery become worse?
- Is there a regression test or size/performance budget to prevent recurrence?
15. FAQ
What is UI jank?
UI jank is visible stutter caused by frames arriving inconsistently or missing display deadlines. It is most noticeable during scrolling, animations, gestures, and transitions.
Is 16.7 ms always the mobile frame budget?
No. Approximately 16.7 ms corresponds to a 60 Hz refresh interval. A 120 Hz display refreshes roughly every 8.3 ms. The practical application budget can also be smaller because other parts of the rendering pipeline require time.
What should I profile first?
Start with one reproducible interaction and capture frame timing together with a CPU or system timeline. Identify which slow frames correspond to main-thread work, layout, rendering, I/O, memory activity, or background contention.
Can asynchronous work still cause jank?
Yes. Background work can consume CPU, storage bandwidth, memory bandwidth, or locks needed by UI code. Moving work off the main thread does not guarantee that it no longer affects responsiveness.
Why does my list stutter while scrolling?
Common causes include expensive cell rendering, unstable item identities, image decoding, per-item database access, excessive allocations, broad state updates, or insufficient virtualization. A frame timeline and CPU trace can distinguish them.
Should I optimize from a debug build?
Debug builds are useful for locating issues, but validate important conclusions with a release-like build on physical hardware. Compiler optimization, logging, assertions, and runtime instrumentation can change performance characteristics.
How do I know whether a performance fix worked?
Repeat the same scenario and compare objective before-and-after metrics: slow-frame count, worst frame duration, trace duration, CPU hotspots, memory behavior, and any relevant startup or interaction measurements.
Key terms (quick glossary)
- UI jank
- Visible stutter or irregular motion caused by inconsistent frame production or missed display deadlines.
- Frame time
- The time associated with preparing, rendering, and presenting a visual frame in the application's display pipeline.
- Frame budget
- The limited amount of time available to perform frame-related work before the next display deadline.
- Dropped frame
- A frame that is not presented as intended because the rendering pipeline did not complete required work in time.
- Main thread
- The application thread responsible for important UI event handling and interface updates on common mobile frameworks.
- System trace
- A timeline showing activity across application threads, operating-system scheduling, rendering, I/O, and other system components.
- CPU profiler
- A tool used to determine where processor time is spent and which call stacks or methods dominate execution.
- Allocation profiler
- A profiling view used to identify object allocation volume, allocation sources, and memory churn.
- Overdraw
- Rendering the same screen pixels multiple times because overlapping layers or views cover previously drawn content.
- Off-screen rendering
- Rendering content into an intermediate surface before composition, sometimes required by effects such as masks, shadows, or complex blending.
- Virtualization
- Creating and rendering only the subset of a large collection that is visible or near the viewport rather than materializing every item.
- Allocation churn
- Repeated creation and disposal of temporary objects that can increase CPU work and garbage-collection pressure.
- Trace marker
- A developer-defined label or interval inserted into a performance trace to identify a meaningful application operation.
- Signpost
- Apple-platform instrumentation used to mark application events or time intervals so they can be correlated with system performance data.
- Performance regression
- A measurable deterioration in responsiveness, frame timing, startup, resource use, or another performance metric between application versions.
- Performance budget
- A predefined acceptable threshold for an interaction, startup path, frame metric, or other measurable performance characteristic.
Worth reading
Recommended guides from the category.