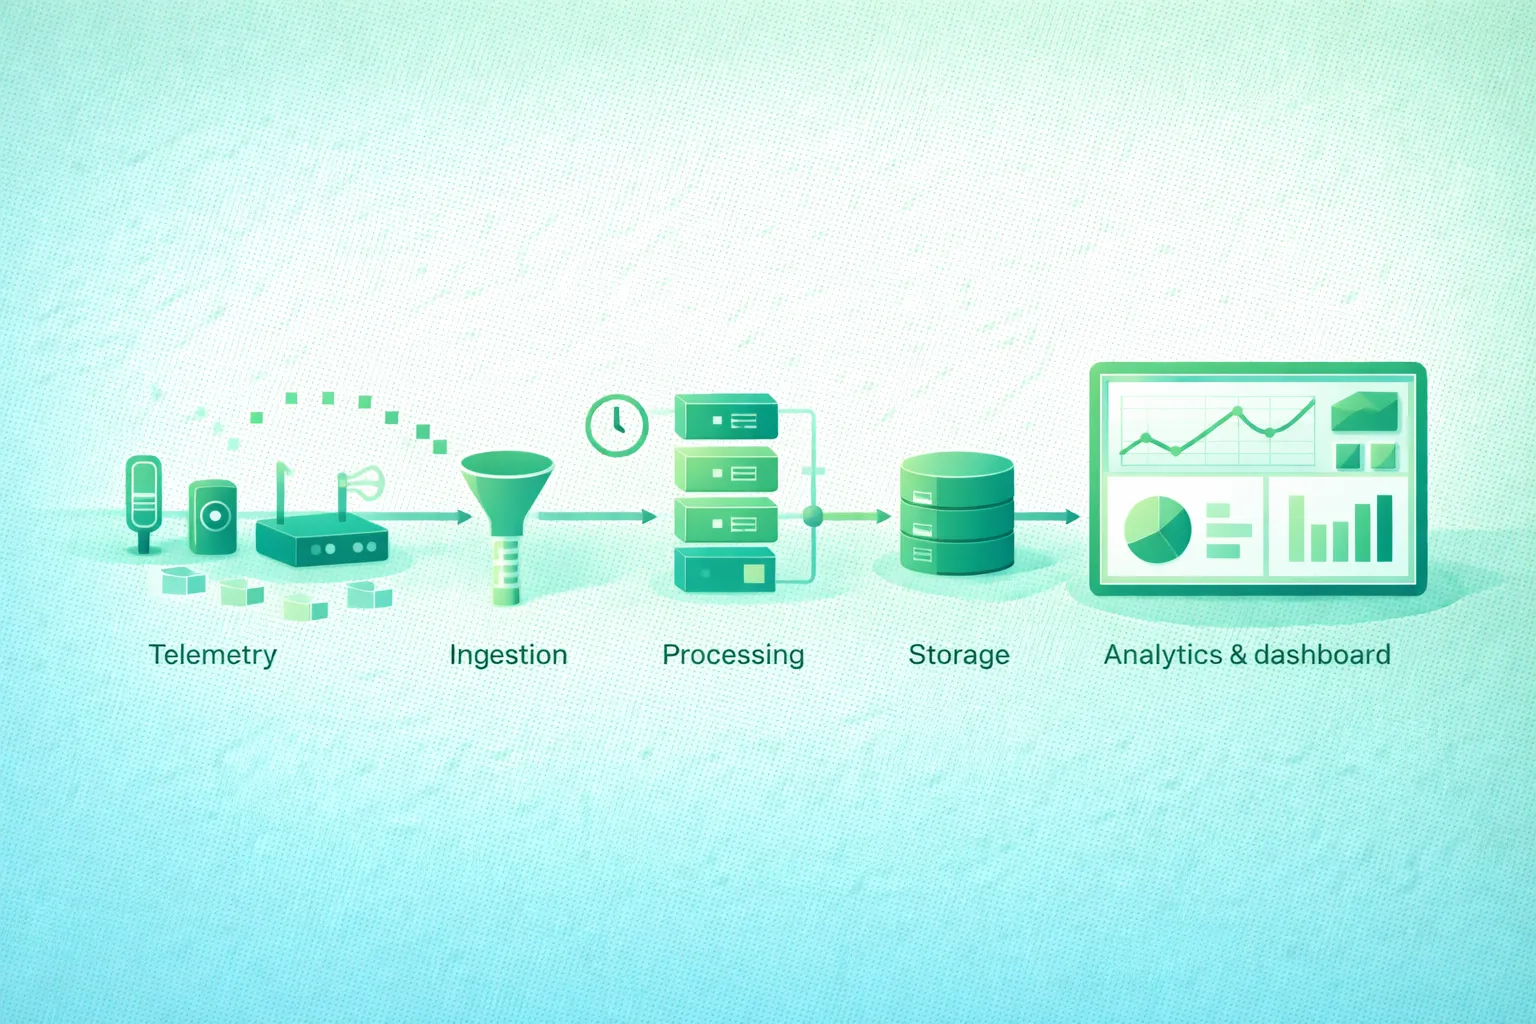
An IoT dashboard is only the final visible layer of a much larger system.
Before a temperature graph appears on screen, the measurement may travel through:
sensor
  ↓
device firmware
  ↓
local network or gateway
  ↓
MQTT broker / HTTPS endpoint
  ↓
authentication
  ↓
validation
  ↓
buffer
  ↓
processing
  ↓
database
  ↓
API
  ↓
dashboard
Every stage can lose, duplicate, delay, corrupt, reject, or misinterpret telemetry.
A good IoT data pipeline therefore does more than move bytes. It preserves enough context to answer:
Which device produced this value?

When was it measured?

When did the server receive it?

Which schema produced it?

Is it valid?

Was it already processed?

Is it still fresh?
Separate ingestion from downstream work
A device connection should not normally depend directly on a dashboard query or a slow analytics job. Introduce a durable or recoverable boundary between accepting telemetry and performing expensive downstream work when reliability requirements justify it.
1. Start with telemetry requirements
Do not begin by choosing a database.
First describe the workload.
Device count
100 devices

or

100,000 devices?
Message frequency
one measurement per hour

or

ten measurements per second?
Payload size
20 bytes

or

20 KB?
Latency
Does the dashboard need a reading within:
1 second
10 seconds
5 minutes?
Retention
7 days
1 year
10 years?
Queries
Typical dashboard questions may be:
latest value for device-17

average temperature
per hour

all alarms
during the last 24 hours

fleet devices
not seen for 30 minutes
Calculate baseline ingest rate
Suppose:
10,000 devices

1 message every 60 seconds
Average rate:
10,000 / 60
≈
167 messages per second
But design for bursts too.
Devices may synchronize after:
- Power restoration.
- Network recovery.
- Firmware restart.
- Gateway reconnection.
2. Separate the pipeline into clear stages
IoT telemetry pipeline architecture (diagram)

A useful logical pipeline is:
Device
  ↓
Transport
  ↓
Ingestion
  ↓
Durable Buffer
  ↓
Validation
  ↓
Normalization
  ↓
Processing
  ↓
Storage
  ↓
API / Alerts
  ↓
Dashboard
Device
Produces measurements and local metadata.
Gateway
Optional gateway functions can include:
- BLE-to-IP translation.
- LoRaWAN backhaul.
- Local buffering.
- Protocol conversion.
- Local aggregation.
Ingestion
Accepts authenticated device traffic.
Examples:
MQTT broker

HTTPS API

managed IoT ingestion service
Buffer
A durable queue or stream can isolate device ingestion from temporary downstream failures.
Processing
May:
- Validate.
- Normalize.
- Enrich.
- Deduplicate.
- Aggregate.
- Detect alarms.
Storage
Different data may belong in different systems.
telemetry:
time-series storage

device metadata:
relational database

raw historical archive:
object storage
3. Design a durable telemetry message
The message format becomes a long-lived API between firmware and backend services.
Example
{
  "schema_version": 2,
  "device_id": "sensor-0017",
  "message_id": "msg-8f241",
  "sequence": 18422,
  "observed_at": "2026-08-25T14:30:00Z",
  "temperature_c": 22.6,
  "humidity_percent": 47.2,
  "battery_mv": 2870
}
Schema version
Firmware evolves.
Old devices may continue producing version 1 while new devices produce version 2.
Device identity
Device identity should normally also come from authenticated connection context.
Do not trust only:
{
  "device_id": "someone-else"
}
when the authenticated client identity belongs to another device.
Observation timestamp
Distinguish:
observed_at:
when sensor measured it

received_at:
when backend received it
These can differ significantly after offline buffering.
Message ID
A stable message identifier can support deduplication.
Sequence number
A monotonic per-device sequence can help detect:
- Missing events.
- Duplicates.
- Out-of-order delivery.
- Device reset.
Units
Avoid ambiguous fields:
"temperature": 72Prefer:
"temperature_c": 22.2or define units explicitly in the schema.
4. Choose MQTT, HTTPS, or a gateway
MQTT
MQTT is a strong fit when:
- Devices maintain broker connections.
- Publish/subscribe routing is useful.
- Cloud-to-device messages are needed.
- QoS semantics are useful.
- Multiple consumers need the same telemetry.
Example topic:
devices/sensor-0017/telemetryHTTPS
HTTPS can be simpler when devices:
- Wake occasionally.
- Upload a batch.
- Do not need persistent server-to-device messaging.
- Already have a conventional REST-style client.
Example:
POST /v1/devices/telemetryGateway
A gateway can buffer measurements when Internet access disappears:
sensor
  ↓
gateway local queue
  X Internet unavailable

later:

Internet restored
  ↓
gateway uploads backlog
Do not assume transport guarantees equal database guarantees
MQTT acknowledgement can confirm a protocol delivery stage.
It does not automatically mean:
validated
stored permanently
visible on dashboard
processed by every consumer
Define where your application's durability boundary actually exists.
5. Validate and normalize before storage
IoT data quality and processing flow (diagram)

A device can be authenticated and still send bad data.
Possible causes:
- Firmware bug.
- Sensor fault.
- Schema mismatch.
- Clock error.
- Corrupted state.
- Compromise.
Validate structure
required:
schema_version
device_id
observed_at
temperature_c
Validate types
temperature_c:
number

not:
"twenty degrees"
Validate plausible ranges
humidity_percent:
0 to 100
Use application-specific limits rather than unrealistic universal values.
Validate timestamps
Flag values such as:
observed_at:
2099-01-01
unless the application has a legitimate reason.
Normalize units
If one hardware generation sends Celsius and another Fahrenheit, convert into a canonical backend representation.
Enrich from trusted metadata
Join telemetry with server-managed information:
device ID
  ↓
site
customer
hardware revision
firmware channel
sensor model
Keep invalid data inspectable
Instead of silently dropping malformed records:
invalid telemetry
   ↓
dead-letter path
   ↓
metrics + investigation
Retain only what is useful and permissible under your data-retention policy.
6. Handle duplicates, ordering, and late data
Duplicates are normal in reliable distributed systems
At-least-once delivery and retries can produce:
message 18422
message 18422
message 18422
If duplicates matter, use:
- Message ID.
- Device ID + sequence number.
- Database uniqueness constraint.
- Idempotent consumer logic.
Do not assume global ordering
A device may produce:
A
B
C
while the backend receives:
A
C
B
due to buffering, reconnects, parallel processing, or retries.
Use event time for historical charts
Suppose:
14:00
sensor measures 20.1 C

14:30
Internet returns

14:31
backend receives measurement
A historical chart should usually place that measurement at 14:00, not 14:31.
Keep receive time too
You still need:
received_atto diagnose ingestion latency and device connectivity.
Define a late-data policy
For example:
less than 1 hour late:
normal processing

1 hour to 7 days late:
store + update historical aggregates

older than 7 days:
archive or reject according to policy
The correct window depends on the application.
7. Match storage to the query pattern
Time-series database
Often useful for:
- Timestamped measurements.
- Time-range queries.
- Aggregations.
- Downsampling.
- Retention policies.
Typical data:
device_id
timestamp
metric
value
Relational database
Useful for:
device inventory
customer ownership
site metadata
alert configuration
user permissions
firmware versions
Object storage
Useful for inexpensive historical archives:
raw telemetry
daily partitions
compressed files
One database can be enough
A small deployment does not need:
Kafka
+
five databases
+
data lake
+
streaming platform
merely because it is an IoT system.
A small fleet may work well with:
MQTT broker
   ↓
ingestion worker
   ↓
PostgreSQL / time-series extension
   ↓
API
   ↓
dashboard
Introduce specialized storage when the workload proves the need
Scale based on measured:
- Write rate.
- Query latency.
- Storage volume.
- Retention cost.
- Aggregation cost.
8. Add stream processing only where useful
Real-time processing can provide:
- Threshold detection.
- Rolling averages.
- Unit conversion.
- Device-state calculation.
- Anomaly detection.
- Routing.
Example rolling average
raw:
22.0
22.5
23.1
24.0
24.3

derived:
5-minute average
Do not discard raw values too early
If the pipeline stores only:
hourly averageyou may later discover that short spikes contained important diagnostic information.
Separate raw and derived data
raw measurement
     ↓
validated raw store
     ↓
aggregation
     ↓
derived series
Make derived data reproducible
Keep enough information to understand:
which algorithm?
which version?
which source data?
which window?
Replay can be valuable
If processing logic changes:
historical raw telemetry
      ↓
new processor version
      ↓
rebuild derived metrics
This is easier when raw data remains available for an appropriate period.
9. Build dashboards from an optimized read path
Dashboards create a different workload from ingestion.
Ingestion workload
many small writes
continuously
Dashboard workload
large time-range reads
aggregations
latest-value lookups
filters
grouping
Use an API layer
browser
  ↓
dashboard API
  ↓
optimized query
  ↓
database / cache
The API can enforce:
- User authorization.
- Tenant isolation.
- Time-range limits.
- Aggregation rules.
- Caching.
Pre-aggregate long ranges
A one-year chart rarely needs every one-second measurement.
Use tiers such as:
last hour:
raw points

last 7 days:
1-minute aggregates

last year:
1-hour aggregates
Keep latest state separately where useful
Instead of repeatedly scanning:
all telemetry
ORDER BY timestamp DESC
LIMIT 1
maintain an optimized latest-state view when query volume justifies it.
10. Treat freshness as part of alerting
Dashboard and alerting data flow (diagram)
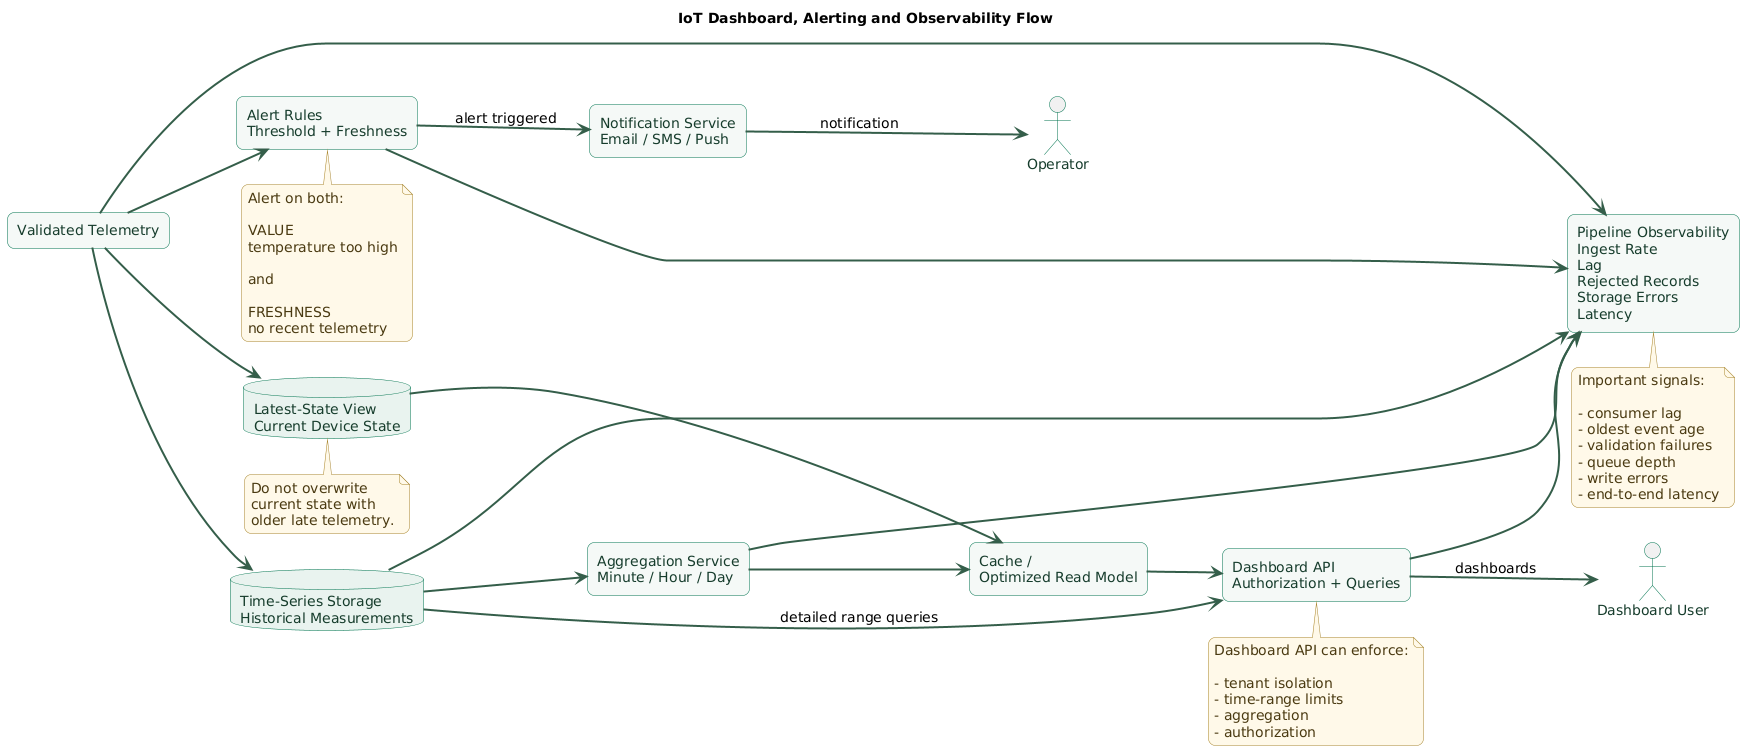
Consider a freezer sensor.
This value:
-18 Clooks healthy.
But if it was last reported:
14 hours agothe system is not healthy.
Alert on value
temperature > -10 C
for 5 minutes
Alert on freshness
last_seen older than
expected interval + tolerance
Separate device offline from sensor alarm
ALARM:
temperature too high

OFFLINE:
no recent telemetry
Operators need different response procedures.
Add hysteresis where appropriate
Avoid:
29.9 normal
30.1 alert
29.9 normal
30.1 alert
when a stateful threshold or minimum duration is more appropriate.
Alert from validated data
A malformed reading such as:
temperature_c:
9000
should not automatically trigger the same operational workflow as a trustworthy physical reading.
11. Design for outages, buffering, and backpressure
Device offline
Decide whether the device:
- Drops data.
- Buffers in flash.
- Buffers through a gateway.
- Retries later.
Broker available, database unavailable
Avoid making the broker or device wait forever for a slow database.
A buffer can create:
ingestion
   ↓
durable stream
   ↓
consumer
   X database unavailable

stream retains backlog

database recovers
   ↓
consumer catches up
Backpressure matters
If incoming rate is:
5,000 events/sbut processing capacity is:
3,000 events/sthe queue grows by:
2,000 events/sBuffering postpones failure. It does not eliminate a permanent capacity deficit.
Monitor consumer lag
Queue depth alone is less useful than:
oldest unprocessed event agebecause that directly describes how stale downstream processing has become.
Use bounded retries
Bad:
invalid event
  ↓
retry forever
  ↓
blocks partition
Better:
temporary error
  ↓
retry with backoff

permanent schema error
  ↓
dead-letter path
Plan replay
Ask:
Can we reprocess yesterday's
telemetry after fixing a bug?
Replay becomes important when processing or storage bugs can be repaired from retained source data.
12. Monitor the pipeline itself
Device telemetry can appear healthy while the pipeline silently loses data.
Ingestion metrics
messages received / second
authentication failures
connection count
payload bytes
rejected messages
Processing metrics
consumer lag
processing latency
validation failures
duplicate count
dead-letter count
retry count
Storage metrics
write latency
write errors
disk usage
query latency
retention jobs
replication health
End-to-end latency
Measure:
dashboard_visible_at
-
observed_at
and separately:
received_at
-
observed_at
to distinguish device/network delay from backend delay.
Data-quality metrics
Track:
- Invalid schema rate.
- Impossible values.
- Missing fields.
- Clock skew.
- Duplicate rate.
- Out-of-order rate.
Fleet freshness
devices seen in last hour
/
expected active devices
This can reveal large connectivity or pipeline incidents quickly.
13. Copy/paste IoT data-pipeline checklist
IoT data pipeline checklist

Requirements
- Count expected devices.
- Estimate maximum fleet size.
- Define average messages per device.
- Define peak messages per device.
- Define payload size.
- Define expected ingestion rate.
- Define burst rate.
- Define dashboard latency target.
- Define alert latency target.
- Define data retention.
- Define raw-data retention.
- Define historical query patterns.
- Define availability requirements.

Device telemetry
- Include stable device identity.
- Include schema version.
- Include observation timestamp.
- Include message ID where useful.
- Include sequence number where useful.
- Define units.
- Define required fields.
- Define optional fields.
- Document payload limits.
- Keep payload backward compatible.

Timestamps
- Distinguish observed_at.
- Distinguish received_at.
- Store timestamps in UTC where practical.
- Handle devices without accurate clocks.
- Detect unreasonable future timestamps.
- Detect unreasonable historical timestamps.
- Track clock skew.
- Preserve event time for historical analysis.

Identity
- Authenticate devices.
- Do not trust payload device_id alone.
- Bind authenticated identity to allowed device resources.
- Reject identity mismatch.
- Track credential state.
- Support revocation.

MQTT
- Define topic hierarchy.
- Apply topic authorization.
- Choose QoS deliberately.
- Handle duplicates.
- Handle reconnects.
- Monitor broker connections.
- Monitor authentication failures.
- Avoid retained telemetry history.
- Use retained state only when semantics fit.

HTTPS
- Authenticate requests.
- Validate TLS.
- Limit request size.
- Validate schema.
- Use idempotency key where useful.
- Define retry behavior.
- Return appropriate status codes.
- Rate-limit abusive clients.

Gateway
- Define supported protocols.
- Authenticate gateway.
- Authenticate downstream devices where possible.
- Buffer during Internet outage.
- Bound local storage.
- Track upload backlog.
- Deduplicate after reconnect.
- Preserve original observation timestamp.
- Monitor gateway last seen.

Ingestion
- Separate connection handling from expensive processing.
- Validate authentication early.
- Reject oversized payloads.
- Record receive timestamp.
- Add durable buffering when requirements justify it.
- Monitor ingress rate.
- Monitor ingress errors.
- Protect against abusive devices.

Buffer / stream
- Define durability requirement.
- Define retention.
- Define partitioning.
- Define ordering guarantees.
- Define replay capability.
- Monitor queue depth.
- Monitor oldest-message age.
- Monitor consumer lag.
- Size for outage scenarios.
- Avoid infinite retention by accident.

Schema validation
- Validate required fields.
- Validate data types.
- Validate schema version.
- Validate payload size.
- Validate timestamp format.
- Validate allowed enums.
- Reject malformed records.
- Track validation failure rate.

Range validation
- Define plausible sensor ranges.
- Avoid universal assumptions.
- Separate physical impossibility from unusual but valid values.
- Record reason for rejection.
- Monitor repeated bad values by device.
- Detect stuck sensors where useful.

Normalization
- Choose canonical units.
- Convert units consistently.
- Normalize timestamps.
- Normalize identifiers.
- Normalize enum values.
- Keep original raw representation when required.
- Version normalization logic.

Enrichment
- Join device metadata.
- Add site ID.
- Add customer ID.
- Add hardware revision.
- Add firmware version where trustworthy.
- Add sensor model.
- Avoid trusting mutable client metadata when server metadata exists.

Deduplication
- Define duplicate key.
- Use message_id where available.
- Use device_id + sequence where appropriate.
- Make consumers idempotent.
- Add unique constraints where useful.
- Track duplicate rate.
- Define deduplication retention window.

Ordering
- Do not assume global order.
- Define whether per-device order matters.
- Use sequence numbers.
- Handle missing sequences.
- Handle reset sequence.
- Handle wraparound if applicable.
- Handle out-of-order events.

Late data
- Define acceptable lateness.
- Store original event time.
- Keep receive time.
- Decide whether aggregates are recomputed.
- Define cutoff for very old events.
- Monitor delayed devices.
- Avoid corrupting recent state with stale telemetry.

Dead-letter handling
- Separate permanent invalid data from temporary failures.
- Record rejection reason.
- Protect sensitive payloads.
- Define retention.
- Alert on spikes.
- Make investigation possible.
- Avoid retrying permanently malformed messages forever.

Processing
- Keep processing idempotent.
- Version transformation logic.
- Separate raw and derived values.
- Define aggregation windows.
- Define event-time semantics.
- Define late-event behavior.
- Monitor processing latency.
- Support replay where justified.

Stream processing
- Use only when real-time transformations are required.
- Avoid unnecessary distributed-system complexity.
- Keep state bounded.
- Define checkpointing.
- Test restart behavior.
- Test duplicate events.
- Test out-of-order events.
- Monitor lag.

Storage
- Match database to query patterns.
- Estimate writes per second.
- Estimate storage growth.
- Estimate indexes.
- Estimate retention cost.
- Test representative queries.
- Define backup.
- Define restore.
- Monitor capacity.

Time-series storage
- Store device identity.
- Store metric.
- Store timestamp.
- Store value.
- Define tags carefully.
- Avoid unbounded high-cardinality labels where system limits make that expensive.
- Define retention.
- Define compression.
- Define downsampling.
- Test long-range queries.

Relational metadata
- Store device inventory.
- Store ownership.
- Store sites.
- Store configuration.
- Store user permissions.
- Store alert rules.
- Keep telemetry volume away from metadata tables when scale justifies separation.

Object storage
- Consider raw archive.
- Partition by time.
- Compress files.
- Define lifecycle policy.
- Encrypt appropriately.
- Restrict access.
- Test historical restore.
- Avoid storing data forever without policy.

Raw telemetry
- Decide whether raw records must be retained.
- Define retention period.
- Protect personal or sensitive data.
- Preserve schema version.
- Preserve original event time.
- Preserve source identity.
- Make replay reproducible.

Aggregations
- Define one-minute aggregates.
- Define hourly aggregates.
- Define daily aggregates where useful.
- Store min.
- Store max.
- Store average.
- Store count.
- Handle missing data.
- Handle late updates.
- Version derived calculations.

Latest state
- Maintain last value where useful.
- Store last observation timestamp.
- Store last receive timestamp.
- Avoid replacing current state with older late data.
- Track freshness.
- Use optimized lookup path for dashboards.

Dashboard API
- Authenticate users.
- Enforce tenant isolation.
- Restrict time ranges.
- Paginate large results.
- Aggregate server-side.
- Cache repeated queries where useful.
- Rate-limit.
- Avoid exposing raw database directly.
- Monitor query latency.

Dashboard
- Display data freshness.
- Display device last seen.
- Distinguish offline from normal.
- Distinguish invalid data from missing data.
- Show timezone clearly.
- Avoid plotting millions of raw points unnecessarily.
- Use aggregation appropriate to viewport.
- Indicate delayed data where useful.

Alerting
- Define threshold rules.
- Define duration.
- Define hysteresis.
- Define recovery rule.
- Define freshness rules.
- Distinguish offline alerts.
- Deduplicate notifications.
- Rate-limit repeated alerts.
- Define escalation.
- Record alert history.

Freshness
- Define expected report interval.
- Define tolerance.
- Track last observed timestamp.
- Track last received timestamp.
- Alert on stale devices.
- Avoid treating old retained values as current data.
- Account for scheduled sleeping devices.

Backpressure
- Measure input rate.
- Measure processing capacity.
- Monitor queue growth.
- Monitor oldest unprocessed event.
- Scale consumers where appropriate.
- Bound retries.
- Protect downstream databases.
- Define overload behavior.

Outages
- Test broker outage.
- Test database outage.
- Test network outage.
- Test gateway outage.
- Test consumer crash.
- Test storage-full condition.
- Test DNS failure.
- Test certificate failure.
- Test recovery backlog.

Retries
- Use backoff.
- Add jitter where useful.
- Bound retries.
- Distinguish temporary and permanent failures.
- Make processing idempotent.
- Monitor retry rate.
- Avoid synchronized retry storms.

Replay
- Define whether replay is supported.
- Define source of truth.
- Preserve raw data long enough.
- Version transformation logic.
- Avoid duplicate side effects during replay.
- Separate notifications from historical recomputation where necessary.
- Test replay before incidents.

Retention
- Define raw retention.
- Define processed retention.
- Define aggregate retention.
- Define dead-letter retention.
- Define log retention.
- Define legal or privacy constraints.
- Automate deletion.
- Monitor retention jobs.

Privacy
- Minimize collected data.
- Avoid unnecessary precise location.
- Avoid unnecessary personal identifiers.
- Separate device ID from user data where useful.
- Encrypt sensitive data.
- Restrict access.
- Define deletion procedure.
- Document retention.

Security
- Authenticate devices.
- Use TLS across untrusted networks.
- Validate server certificates.
- Apply least privilege.
- Protect broker or API credentials.
- Rotate credentials.
- Protect database credentials.
- Restrict administrative access.
- Monitor authentication failures.

Observability
- Monitor ingest rate.
- Monitor accepted events.
- Monitor rejected events.
- Monitor queue depth.
- Monitor consumer lag.
- Monitor processing latency.
- Monitor database writes.
- Monitor database errors.
- Monitor dashboard latency.
- Monitor alert-delivery failures.

End-to-end monitoring
- Measure observed_at to received_at.
- Measure received_at to stored_at.
- Measure stored_at to dashboard visibility.
- Measure alert latency.
- Track percentile latency.
- Detect unusual pipeline delay.
- Distinguish network delay from backend delay.

Data quality
- Track invalid schemas.
- Track impossible values.
- Track missing fields.
- Track duplicates.
- Track out-of-order events.
- Track stale measurements.
- Track clock drift.
- Track silent devices.

Cost
- Estimate broker cost.
- Estimate queue or stream cost.
- Estimate database cost.
- Estimate object-storage cost.
- Estimate network egress.
- Estimate dashboard query cost.
- Estimate monitoring cost.
- Estimate retention cost.
- Downsample old data where appropriate.

Small architecture
- Start simple.
- Use one broker.
- Use one ingestion service.
- Use one suitable database.
- Add dashboard API.
- Add alerting.
- Add monitoring.
- Introduce additional components only when requirements justify them.

Scaling
- Benchmark ingestion.
- Benchmark writes.
- Benchmark queries.
- Test burst traffic.
- Test reconnect storm.
- Test backlog recovery.
- Partition where required.
- Scale consumers independently.
- Avoid premature microservice decomposition.

Schema evolution
- Version messages.
- Maintain backward compatibility.
- Support old firmware.
- Deploy consumers before producers when appropriate.
- Test mixed fleet versions.
- Deprecate old schema deliberately.
- Track schema adoption.

Firmware changes
- Review telemetry changes.
- Review payload growth.
- Review reporting frequency.
- Review new fields.
- Review battery cost.
- Review backend compatibility.
- Test with production-like pipeline.

Operations
- Keep architecture diagram.
- Document ownership.
- Document runbooks.
- Document replay procedure.
- Document database recovery.
- Document backlog recovery.
- Document dead-letter review.
- Define on-call alerts.

Final review
- Can every message be attributed to an authenticated device?
- Is observation time preserved?
- Is receive time preserved?
- Is schema version explicit?
- Can duplicates be handled safely?
- Can out-of-order data be handled?
- Can offline devices upload historical data correctly?
- Can invalid data be investigated?
- Is there a durable boundary where needed?
- Can downstream outages be absorbed temporarily?
- Is queue lag monitored?
- Is storage matched to query patterns?
- Are dashboards using an optimized read path?
- Are stale devices visible?
- Are alerts based on validated data?
- Can raw data be replayed where required?
- Is retention intentional?
- Is sensitive telemetry protected?
- Is end-to-end pipeline latency observable?
- Has the architecture been kept as simple as the requirements allow?
14. FAQ
What is an IoT data pipeline?
It is the chain of systems that receives device telemetry, validates and processes it, stores it, and makes it available to dashboards, alerts, APIs, analytics and operational tools.
Should I use MQTT or HTTPS for telemetry?
MQTT is often useful for persistent publish/subscribe communication, bidirectional device messaging and several independent consumers. HTTPS can be simpler for devices that wake, upload a batch and disconnect. Both can be appropriate depending on the product.
Do I need Kafka or another distributed stream for IoT?
Not automatically. A small fleet can often use a broker, one ingestion worker and a suitable database. A durable distributed stream becomes more valuable when independent consumers, replay, large backlogs, high throughput or stronger decoupling justify its operational cost.
Which database should store sensor telemetry?
Time-series storage is often useful for timestamped measurements and aggregations. Relational databases are often useful for device metadata, while object storage can provide inexpensive raw archives. The right choice depends on write rate, query patterns, retention and operational requirements.
How do I handle duplicate telemetry?
Include a unique message identifier or useful per-device sequence number and make ingestion idempotent where practical. Database uniqueness constraints or a bounded deduplication cache can also help.
What is late IoT data?
Late data is telemetry whose observation time is substantially earlier than its ingestion time. This often happens when devices or gateways buffer measurements during an outage and upload them after connectivity returns.
Should an offline device trigger an alert?
Usually yes when timely reporting is required. A valid old reading does not prove current health, so alerting should often include a separate freshness or last-seen rule.
Key terms (quick glossary)
- Telemetry
- Measurements, state and diagnostic information produced by devices and sent to another system for monitoring, storage or analysis.
- Ingestion
- The stage of a data pipeline responsible for accepting incoming data from devices, gateways or communication infrastructure.
- Event time
- The time at which an event or measurement occurred at its source, distinct from the time the backend received or processed it.
- Receive time
- The time at which the backend ingestion layer received a telemetry message.
- Schema
- The defined structure, field types and semantics expected for a telemetry message.
- Normalization
- Conversion of incoming data into a consistent representation, such as canonical units, identifiers or timestamp formats.
- Enrichment
- Addition of trusted metadata such as site, customer, hardware revision or device type to an incoming telemetry record.
- Deduplication
- Detecting and preventing repeated delivery of the same logical event from producing unintended duplicate data or side effects.
- Idempotency
- A property in which processing the same logical operation more than once produces the same intended result as processing it once.
- Backpressure
- The condition in which downstream processing cannot keep up with incoming data and work begins accumulating in queues or buffers.
- Consumer lag
- The difference between incoming data and the point a downstream consumer has processed, commonly measured as event count, time or oldest-message age.
- Dead-letter queue
- A storage path for messages that cannot be processed normally and need later investigation or special handling.
- Time-series database
- A database optimized for data indexed primarily by time, commonly used for metrics, sensor measurements and historical telemetry.
- Downsampling
- Reducing the number of stored or queried data points by creating lower-resolution aggregates for longer time ranges.
- Replay
- Reprocessing previously stored events through pipeline logic, commonly after repairing a bug or changing a transformation.
- Data freshness
- A measure of how recently a device or data source produced a valid measurement relative to its expected reporting interval.
- Gateway
- An intermediary device or service connecting sensors to another network and sometimes providing buffering, protocol conversion or local processing.
Worth reading
Recommended guides from the category.