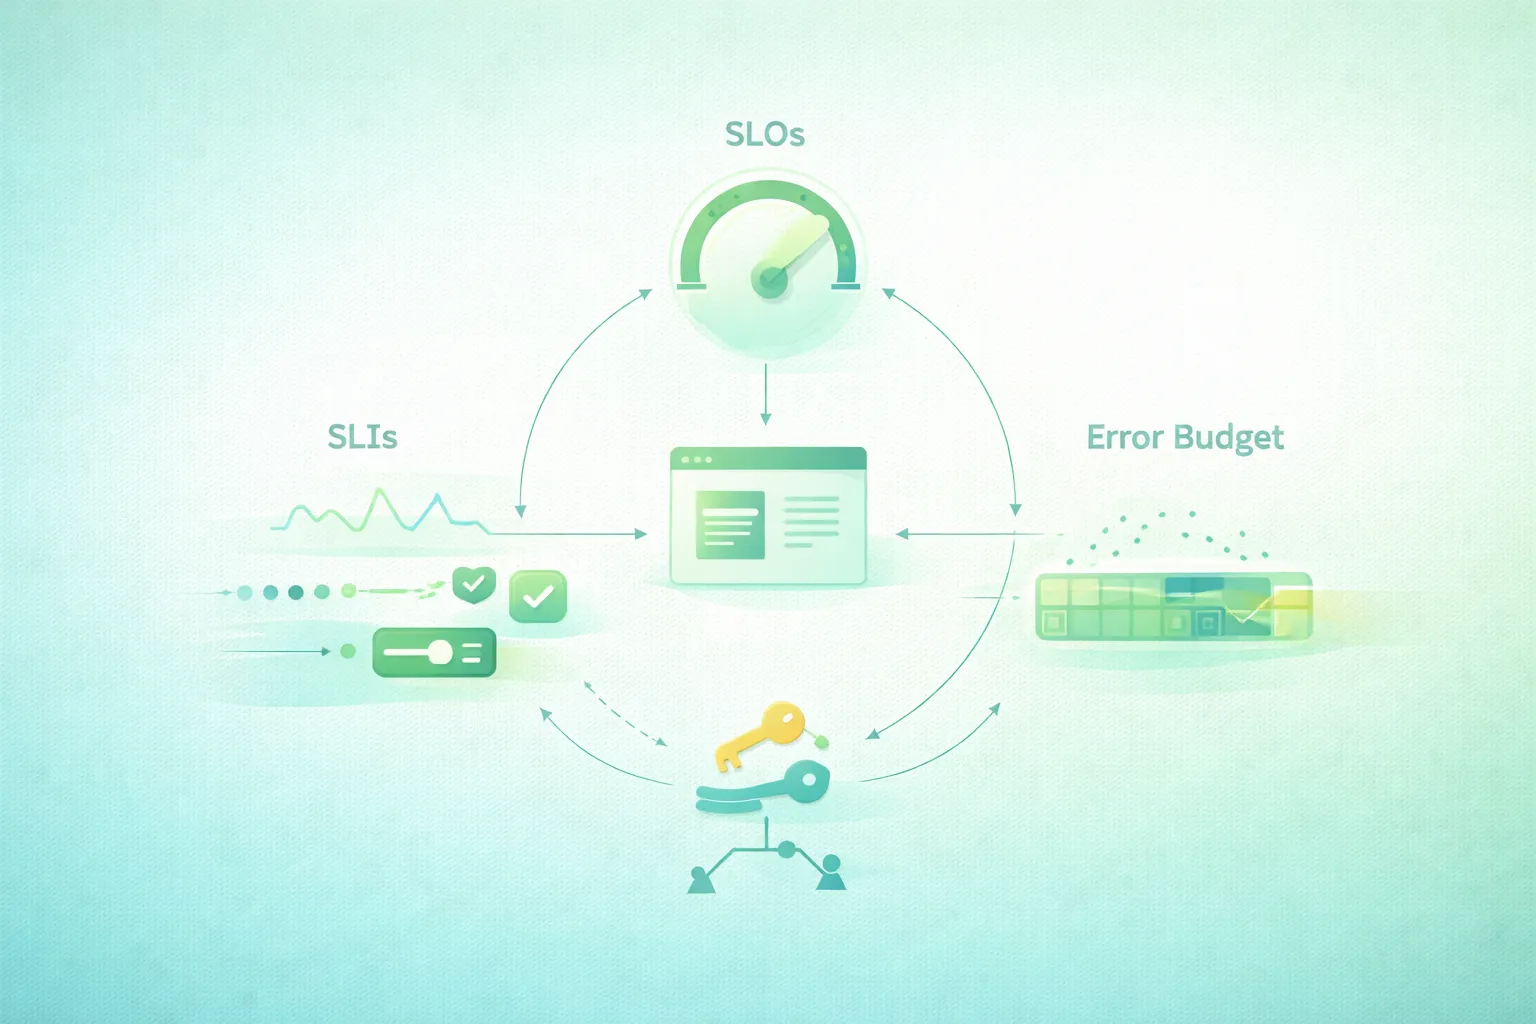
Reliability discussions often begin with statements that sound precise but are difficult to use:
the site should be highly available
the API should be fast
production should almost never fail
we need five nines
Site Reliability Engineering provides a more practical vocabulary.
Instead of asking whether a system is “reliable,” define what users need, measure whether they received it, establish the acceptable reliability target, and explicitly decide how much failure the organization can tolerate.
Three concepts form the core of that process:
SLI
What are we measuring?

SLO
What target should that measurement meet?

Error budget
How much failure can occur
without violating that target?
Begin with the user, not the server
A database can report 100% uptime while the application returns errors. A server can have low CPU while users wait five seconds for every request. Useful reliability objectives measure outcomes that represent what users actually experience.
1. What SRE is trying to solve
Engineering teams constantly trade reliability against other goals.
New releases create product value, but every change can also introduce failure. More redundancy can improve availability, but it costs money. More conservative deployments may reduce operational risk, but they can slow delivery.
Without explicit targets, these discussions become subjective:
Product:
"We need to release faster."

Operations:
"The service is too unstable."

Engineering:
"How stable is stable enough?"
SLOs provide a shared reliability boundary.
When reliability is comfortably inside that boundary, the team has room to move quickly. When reliability degrades and the error budget is disappearing, reliability work deserves more attention.
SRE does not require a dedicated SRE department
A team of three developers can use SRE ideas.
You need:
- A meaningful user journey.
- A measurable signal.
- A target.
- A monitoring window.
- A response when reliability misses the target.
The value comes from decision-making, not organizational titles.
2. SLI: measure a user-relevant outcome
SLI to SLO to error budget flow (diagram)

SLI stands for Service Level Indicator.
It is a quantitative measurement of a service behavior that matters to users.
Availability SLI
For an HTTP API:
successful eligible requests
----------------------------
total eligible requests
Suppose:
total eligible requests = 1,000,000
successful requests     =   999,200
failed requests         =       800
The measured SLI is:
999,200 / 1,000,000
= 99.92%
Latency SLI
Instead of averaging response time, define a good request as one that finishes below a user-relevant threshold:
eligible requests completed below 500 ms
-----------------------------------------
total eligible requests
This produces another percentage that can be compared directly with an objective.
Other useful SLIs
Depending on the service:
- Freshness of generated data.
- Correctness of results.
- Durability of accepted writes.
- Successful completion of background jobs.
- Successful checkout attempts.
- Time required to process queued work.
Define eligible events explicitly
Consider an API receiving:
GET /products
POST /checkout
GET /health
GET /robots.txt
Should every request count equally toward the same SLI?
Maybe not.
A critical checkout workflow may deserve its own objective while health probes and static files may not represent a user journey at all.
Define good events explicitly
For availability:
eligible event:
user request to production API

good event:
request produces an accepted
non-service-error result
Be precise about HTTP status handling.
For example, a correctly returned 404 for a resource that
does not exist may represent successful service behavior. A
503 generated because the backend failed usually does not.
Measure close to the user experience
Imagine:
browser
   ↓
CDN
   ↓
load balancer
   ↓
application
Application metrics cannot see requests that fail before reaching the application.
Measurements at the edge or load-balancer layer may therefore represent user-visible availability more accurately.
3. SLO: turn the measurement into a reliability target
SLO stands for Service Level Objective.
It specifies the target value that an SLI should achieve over a defined measurement window.
Availability example
SLI:
percentage of eligible API requests
that complete successfully

SLO:
at least 99.9% over a rolling 30-day window
Latency example
SLI:
percentage of eligible checkout requests
completed in less than 500 ms

SLO:
at least 99% over a rolling 30-day window
An SLO needs four things
1. Event population
2. Definition of good
3. Target percentage
4. Measurement window
“99.9% availability” alone is incomplete.
A more useful statement is:
Over a rolling 30-day window,
at least 99.9% of eligible
production API requests measured
at the load balancer will complete
without a service-side failure.
Do not automatically choose 99.99%
Additional reliability becomes increasingly expensive.
Moving from:
99%
to
99.9%
to
99.99%
to
99.999%
progressively reduces the permitted failure budget.
Higher targets can require:
- More redundancy.
- More sophisticated failover.
- More testing.
- Safer deployment systems.
- More operational staffing.
- More expensive dependencies.
Set the target around what users and the business actually require.
Start from observed behavior
If an existing service currently achieves:
99.72%
99.81%
99.76%
99.83%
declaring a 99.99% objective tomorrow does not make the service 99.99% reliable.
It creates a permanent violation.
Use historical measurements, customer expectations, dependency reliability, architecture, and business impact to choose an initial target that can guide real decisions.
SLO is not SLA
These terms are related but serve different purposes.
SLI
measurement

SLO
internal reliability target

SLA
agreement or commitment,
often external and potentially
associated with consequences
An internal SLO can intentionally be stricter than a contractual SLA, giving the team operating margin before an external commitment is at risk.
4. Error budget: define acceptable unreliability
If an SLO does not require perfection, the difference between the target and 100% represents permitted failure.
This is the error budget.
error budget = 100% - SLOExample: 99.9% availability
SLO          = 99.9%
Error budget =  0.1%
If the service receives exactly:
1,000,000 eligible requestsduring the window, the budget permits:
1,000,000 × 0.001
= 1,000 bad requests
Error budget remaining
Suppose 250 requests have already been classified as bad:
total budget:
1,000 bad requests

consumed:
250

remaining:
750

budget consumed:
25%

budget remaining:
75%
Why deliberately allow failure?
Because engineering for literal perfection is usually not economically or technically useful.
If users remain satisfied at 99.9%, spending enormous effort to reach theoretical 100% may produce less value than improving features, performance, security, or usability.
The error budget creates a controlled amount of acceptable risk.
The budget is not permission to create outages
An error budget means:
some failure is expected
and explicitly accounted for
not:
we should intentionally spend
all remaining errors before
the month ends
It provides a decision boundary for balancing reliability and change.
5. Build a practical availability SLO
Begin with one critical service.
Suppose you operate an online store API.
Step 1: select the user journey
customer uses public APIStep 2: define eligible requests
For example:
production HTTP requests
for customer-facing API routes
You may intentionally exclude:
- Internal health probes.
- Metrics endpoints.
- Development traffic.
- Known synthetic load tests.
Document every exclusion.
Step 3: define good requests
For example:
requests not resulting
in service-side failure
Avoid automatically treating every 4xx response as a service failure if the application correctly rejected an invalid client request.
At the same time, do not create exclusions merely to make the percentage look better.
Step 4: calculate the SLI
good requests
-------------
eligible requests
Step 5: choose the objective
99.9% over rolling 30 daysExample Prometheus-style calculation
sum(
  rate(
    http_requests_total{
      service="store-api",
      status!~"5.."
    }[5m]
  )
)
/
sum(
  rate(
    http_requests_total{
      service="store-api"
    }[5m]
  )
)
Real implementations often need more careful classification of eligible routes and failure categories, but the numerator/denominator model is a useful starting point.
6. Build a practical latency SLO
Average latency is often a poor SLI.
Consider ten requests:
100 ms
110 ms
120 ms
105 ms
115 ms
100 ms
110 ms
120 ms
105 ms
8,000 ms
One user experienced an eight-second request even though the average may still obscure the shape of the experience.
Define good latency events
For example:
good:
checkout request completes
below 500 ms

eligible:
all production checkout requests
The SLI becomes:
requests below 500 ms
---------------------
eligible requests
Example objective
99% of checkout requests
complete below 500 ms
over a rolling 30-day window
Multiple latency thresholds can represent different experiences
You might decide:
99% below 500 ms

and

99.9% below 2 seconds
Use additional objectives only when each threshold captures a distinct reliability requirement.
Do not define latency around infrastructure alone
Database query duration may help diagnose latency but is rarely the user-facing SLI itself.
Prefer:
request duration seen
at the service boundary
with internal signals such as:
database query duration
cache hit rate
upstream latency
CPU saturation
used as diagnostic metrics.
7. Choose the measurement window
An objective requires a period over which success and failure are evaluated.
Common choices include:
- 28-day rolling window.
- 30-day rolling window.
- Calendar month.
- Quarter for some business reporting.
Rolling windows
A rolling 30-day window always looks backward 30 days from the current moment.
today
  ↓
previous 30 days
  ↓
current SLO state
This gives responders a continuously updated reliability view.
Calendar windows
A calendar-month SLO resets at the beginning of each month.
This can align naturally with reporting but creates a sharp boundary:
August 31 incident
and
September 1 incident

can land in two
different SLO periods
Keep the main objective consistent
Avoid changing the official SLO window depending on which stakeholder is looking at the dashboard.
You can still calculate short-term views for alerting and long-term views for trend analysis.
8. Use burn rate to detect dangerous budget consumption
Error budget burn-rate model (diagram)
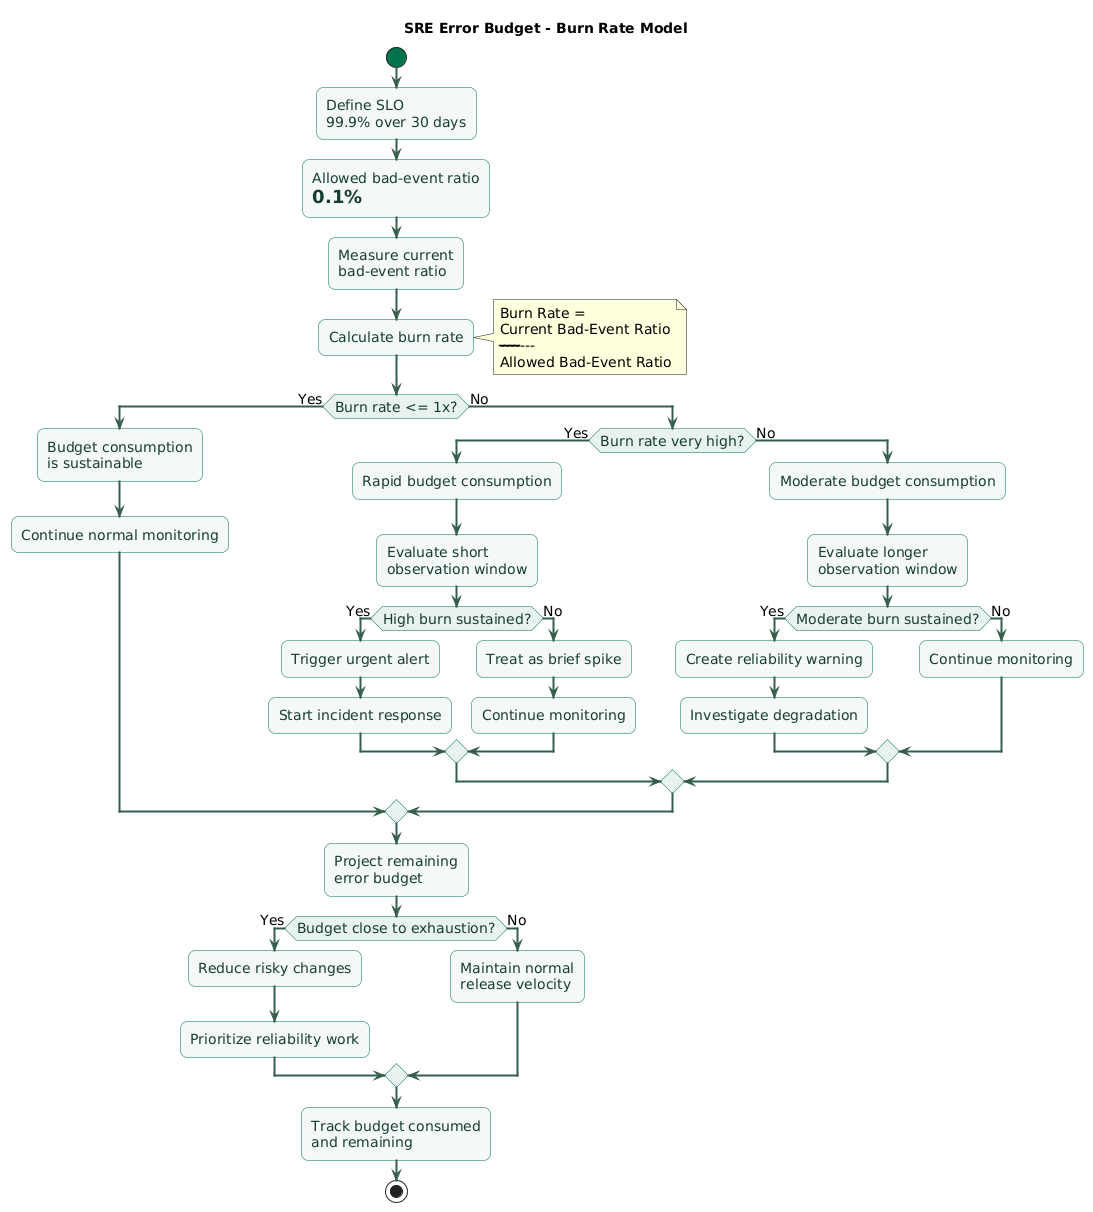
Knowing that 40% of your budget is gone is useful, but it does not tell you how quickly the problem is developing.
Burn rate adds velocity.
Burn rate of 1
A burn rate of approximately:
1xmeans the budget is being consumed at the rate that would use the full budget over the entire SLO window if sustained.
Burn rate greater than 1
2x
5x
10x
20x
means failure is consuming budget faster than the sustainable pace.
Conceptually, sustained 10x burn would exhaust the available
budget in roughly one tenth of the normal SLO window.
Example
Assume:
SLO = 99.9%

allowed bad-event ratio = 0.1%
If the current bad-event ratio is:
1%then relative to the allowed rate:
1% / 0.1%
= 10x burn rate
Why alert on burn rate?
A simple alert such as:
availability below 99.9%
for five minutes
can be either too sensitive or too slow depending on traffic and incident severity.
Burn-rate alerts ask a more operationally relevant question:
Is the current failure rate
consuming our reliability budget
dangerously fast?
Use multiple observation windows
Short windows detect sudden severe incidents quickly.
Longer windows help confirm that the problem is sustained and prevent one brief spike from creating excessive noise.
Conceptually:
very fast burn
    ↓
short-window alert
    ↓
urgent response

moderate sustained burn
    ↓
longer-window alert
    ↓
investigation before
budget exhaustion
9. Turn the error budget into an engineering policy
An error budget dashboard that never changes engineering behavior is only another graph.
Define what the team does as the budget changes.
Healthy budget
reliability comfortably within SLO
        ↓
normal release velocity
Budget consumption increasing
unexpected reliability degradation
        ↓
investigate repeated failure causes
        ↓
prioritize reliability improvements
Budget nearly exhausted
The team might:
- Pause risky releases.
- Prioritize recurring reliability defects.
- Improve rollback or deployment safety.
- Add capacity.
- Fix dependency failures.
- Address operational toil contributing to incidents.
Budget exhausted
A written policy might state:
If the API exhausts its
30-day availability error budget:

1. Freeze non-essential high-risk changes.
2. Review the incidents that consumed budget.
3. Prioritize reliability actions.
4. Resume normal change velocity once
   reliability risk is under control.
Make the policy proportional
A small internal tool does not necessarily need the same governance as a revenue-critical payment API.
Keep the policy simple enough that the team will actually follow it.
Use the budget to resolve product-versus-reliability arguments
Without an SLO:
Is reliability good enough?
Depends who you ask.
With an SLO:
Are we meeting the user-facing objective?
How much budget remains?
How fast are we consuming it?
Which incidents consumed it?
The discussion becomes much more concrete.
10. Implement SLO monitoring without overcomplicating it
A small team does not need an expensive dedicated SLO platform on day one.
Existing metrics infrastructure can be enough.
Start with counters and histograms
Useful application metrics might include:
http_requests_total
http_request_duration_seconds
Keep sufficient dimensions
You may need labels such as:
service
route
method
status_class
Avoid high-cardinality fields such as request IDs or user IDs.
Record good and total events
Conceptually, every ratio-based SLI needs:
good events
total eligible events
From these you can calculate:
- Current SLI.
- Bad-event ratio.
- Error budget consumed.
- Error budget remaining.
- Burn rate.
Create one SLO dashboard
Show:
Current SLI
SLO target
Error budget remaining
Budget consumed
Current burn rate
Recent incidents
Deployment annotations
Keep diagnostic dashboards separate
The SLO dashboard answers:
Are users receiving
the promised reliability?
A diagnostic dashboard answers:
Why is reliability failing?Diagnostic signals can include:
- CPU.
- Memory.
- Database connections.
- Queue depth.
- Dependency latency.
- Cache hit ratio.
Monitor the SLI data path
If telemetry disappears, the dashboard may look misleadingly quiet.
Monitor:
- Metric collection failures.
- Missing targets.
- Unexpected zero traffic.
- Failed recording rules.
- Broken external probes.
11. Common SLO mistakes
Choosing the target first
Bad process:
We want 99.99%.

Now find a metric.
Better:
What user experience matters?
How can we measure it?
What reliability do users need?
What can the architecture support?
Using infrastructure uptime as the user SLI
A VM being reachable does not mean checkout works.
Use infrastructure health for diagnosis and capacity management, but keep the principal SLO tied to user-visible service behavior.
Defining too many SLOs
If your first SRE project creates:
47 SLOs
86 alerts
12 dashboards
the team will struggle to determine which objectives actually matter.
Start with critical journeys.
Creating exclusions after incidents
Imagine an outage causes 20,000 failed requests.
Do not decide afterward:
Those failures should
probably not count.
Eligibility and exclusions should be defined before incidents whenever possible.
Targeting 100%
A 100% target leaves no explicit tolerance for:
- Deployments.
- Dependency failures.
- Maintenance.
- Software defects.
- Infrastructure events.
It also removes the error-budget mechanism that helps teams balance reliability and innovation.
Ignoring low traffic
Percentage-based SLIs become noisy when event volume is tiny.
If a service receives only ten requests:
1 failure
=
90% success
Low-volume services may need longer windows, synthetic checks, time-based availability, or another measurement that better represents their user experience.
Making an SLO impossible because dependencies are weaker
If your critical request depends synchronously on an upstream service with weaker reliability than your objective, achieving the stronger objective may require:
- Caching.
- Retries with appropriate limits.
- Fallback behavior.
- Redundant providers.
- Architectural decoupling.
Writing a larger number in a document does not overcome dependency limits.
Never revisiting an SLO
SLOs should evolve when:
- User expectations change.
- Traffic changes materially.
- The product becomes more critical.
- Architecture changes.
- Historical data shows the target is poorly calibrated.
12. A small-team SRE rollout
SLO design decision tree (diagram)
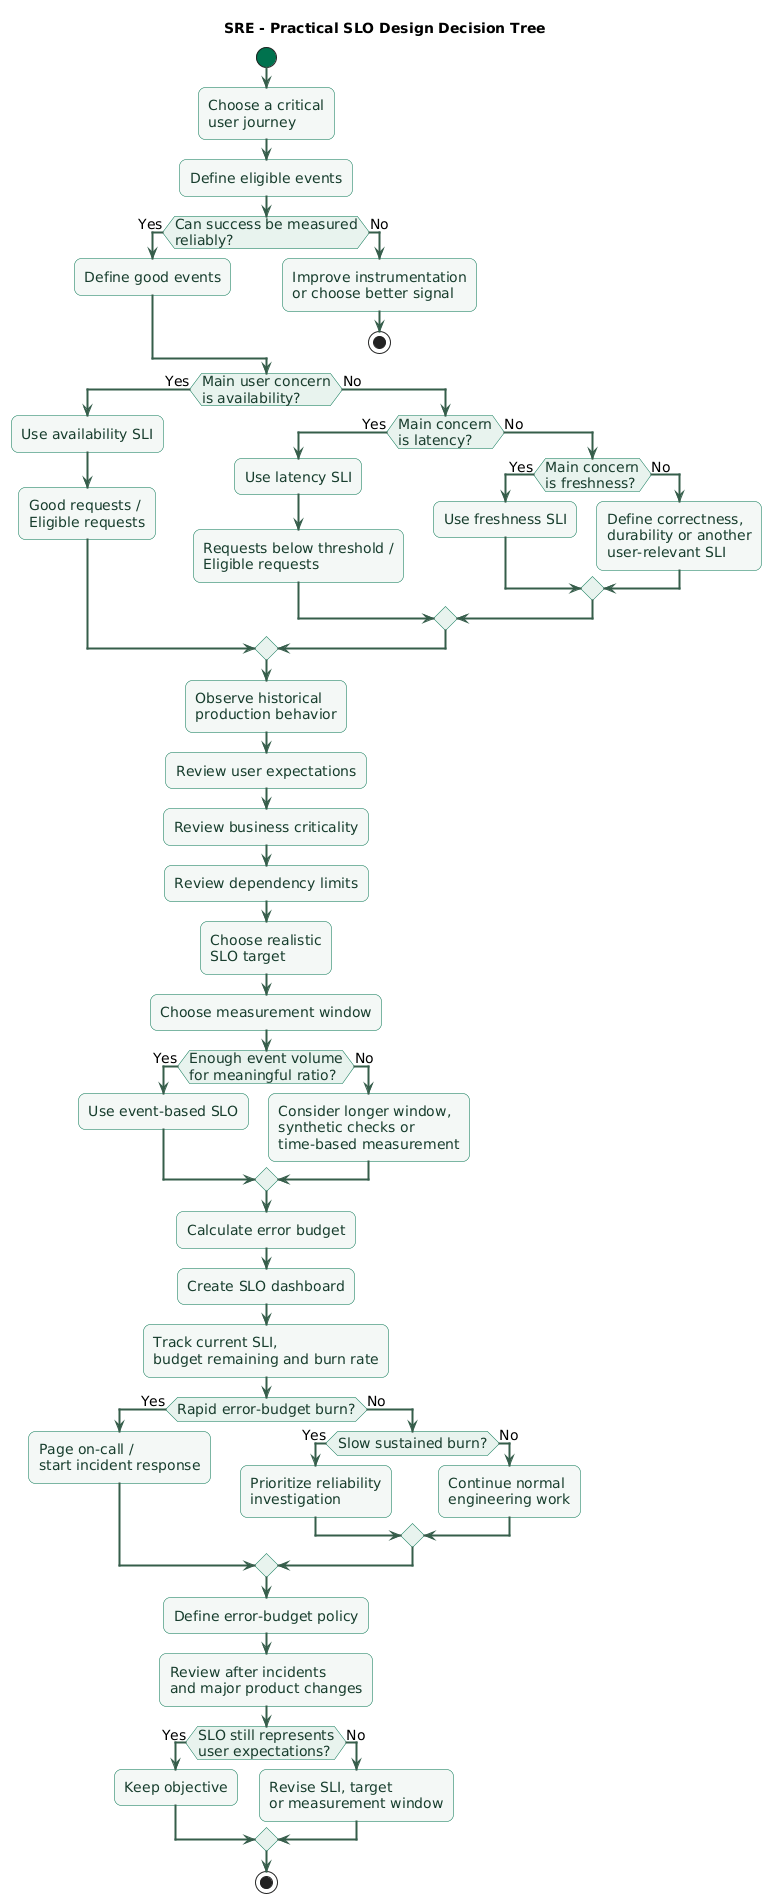
Step 1: choose one critical user journey
Example:
user loads application dashboardor:
customer submits checkoutStep 2: define the SLI specification
percentage of checkout attempts
that successfully complete
Do this before worrying about PromQL.
Step 3: define the implementation
eligible requests:
POST /checkout requests
measured at load balancer

good:
accepted completion responses
without service-side failure
Step 4: observe baseline behavior
Collect enough history to understand:
- Normal success rate.
- Incident frequency.
- Dependency behavior.
- Traffic variation.
Step 5: choose an initial objective
For example:
99.9% over rolling 30 daysStep 6: calculate the budget
100% - 99.9%
=
0.1% bad events allowed
Step 7: build the dashboard
SLO target
current SLI
budget remaining
budget consumed
burn rate
Step 8: add alerts
Prefer alerts that detect dangerous budget consumption rather than every tiny threshold fluctuation.
Step 9: write the policy
Define what happens when:
- Burn rate spikes.
- Most budget is consumed.
- The budget is exhausted.
Step 10: review after incidents
Ask:
Did the SLI represent user impact?
Did the SLO classify this incident appropriately?
Did alerting respond soon enough?
Did the budget policy change our priorities?
Step 11: add another SLO only when needed
After availability works well, add latency or another distinct user-visible requirement.
13. Copy/paste SLI, SLO, and error budget checklist
SRE SLI / SLO / error budget checklist

Service scope
- Identify the production service.
- Identify service owner.
- Identify important users.
- Identify critical user journeys.
- Identify critical dependencies.
- Define what user-visible failure means.
- Avoid beginning with infrastructure metrics.

User journey
- Pick one important journey first.
- Describe the journey in plain language.
- Identify where the user enters the system.
- Identify where success becomes observable.
- Identify important failure modes.
- Decide whether separate user classes need separate objectives.

SLI specification
- Define what service outcome matters.
- Keep the definition independent of monitoring implementation.
- Decide whether availability matters.
- Decide whether latency matters.
- Decide whether freshness matters.
- Decide whether correctness matters.
- Decide whether durability matters.
- Avoid metrics that users cannot perceive unless they explain a user outcome.

Eligible events
- Define the denominator.
- Identify which production requests count.
- Exclude health probes when appropriate.
- Exclude metrics scrapes when appropriate.
- Exclude synthetic tests when appropriate.
- Document exclusions.
- Avoid changing exclusions after an outage merely to improve the result.
- Review whether client errors should count.
- Review whether cancelled requests should count.
- Review whether requests blocked before reaching the application are visible.

Good events
- Define the numerator.
- Define successful response behavior.
- Define acceptable status codes.
- Define latency threshold when measuring speed.
- Define freshness threshold when measuring data age.
- Define correctness criteria where measurable.
- Ensure engineers interpret good events consistently.

Measurement point
- Measure as close to the user experience as practical.
- Consider load-balancer metrics.
- Consider edge metrics.
- Consider external probes.
- Understand blind spots in application-only metrics.
- Document the measurement source.
- Monitor the measurement pipeline itself.

Availability SLI
- Count eligible requests.
- Count good requests.
- Calculate good / eligible.
- Verify request classification.
- Handle partial failures.
- Keep health checks separate from user requests.
- Compare SLI behavior with real incidents.

Latency SLI
- Choose a user-relevant latency threshold.
- Prefer threshold-based good-event ratios where appropriate.
- Avoid relying only on averages.
- Consider tail latency.
- Consider multiple thresholds only when each represents a meaningful user experience.
- Measure near the service boundary.
- Keep internal component latency for diagnosis.

Freshness SLI
- Define maximum acceptable data age.
- Define which users or responses require fresh data.
- Measure successful fresh responses.
- Track stale responses as bad events.
- Avoid defining freshness more strictly than users require.

Correctness SLI
- Define observable correct outcome.
- Build automated validation where possible.
- Count correct outcomes.
- Count eligible outcomes.
- Avoid using correctness SLOs that cannot actually be measured.

SLO target
- Choose a target after defining the SLI.
- Review historical reliability.
- Review user expectations.
- Review product criticality.
- Review business impact.
- Review dependency reliability.
- Review architecture capability.
- Review cost of higher reliability.
- Avoid copying an industry percentage without justification.
- Avoid defaulting to 100%.

Measurement window
- Choose one primary SLO window.
- Consider rolling 28 or 30 days.
- Consider calendar periods when reporting requires them.
- Document window semantics.
- Keep historical trend views separately.
- Avoid changing the official window per stakeholder.
- Ensure enough event volume exists for meaningful measurement.

Error budget
- Calculate 100% minus SLO.
- Convert the percentage to bad events where useful.
- Track budget consumed.
- Track budget remaining.
- Show budget on a dashboard.
- Associate incidents with budget consumption.
- Avoid treating remaining budget as a requirement to create failure.

Request-based budget
- Count eligible requests.
- Calculate allowed bad-event ratio.
- Multiply event volume by allowed ratio.
- Update calculations as traffic changes.
- Prefer request-based availability where partial failures and varying traffic matter.

Time-based budget
- Use time-based availability when it reflects the user experience better.
- Define sampling interval.
- Define when a time interval is good.
- Consider external probes.
- Account for low-traffic services.
- Document limitations.

Burn rate
- Calculate current bad-event ratio.
- Divide by allowed bad-event ratio.
- Interpret approximately 1x as sustainable full-window consumption.
- Treat higher burn as faster exhaustion risk.
- Track burn rate on the SLO dashboard.
- Use burn rate for alerting.
- Avoid treating every short spike as a page.

Fast-burn alerting
- Detect severe incidents quickly.
- Use a short observation window.
- Confirm sustained impact with a second window where appropriate.
- Page when immediate action can preserve substantial error budget.
- Link the alert to the SLO dashboard.
- Link the alert to a runbook.

Slow-burn alerting
- Detect persistent degradation.
- Use longer observation windows.
- Route non-emergency reliability work appropriately.
- Prevent slow regressions from consuming the entire monthly budget unnoticed.
- Avoid waking someone unnecessarily for a problem that can safely wait.

Error budget policy
- Write the policy before the budget is exhausted.
- Define service owner.
- Define actions at high burn.
- Define actions when most budget is consumed.
- Define actions when the budget is exhausted.
- Define who can approve exceptions.
- Define when risky releases pause.
- Define when reliability work becomes priority.
- Keep the policy proportionate to service criticality.
- Get product and engineering agreement.

Release decisions
- Review error budget before risky releases.
- Consider recent incidents.
- Consider current burn rate.
- Consider expected release risk.
- Pause high-risk changes when reliability is already severely degraded.
- Do not use SLOs as an excuse to block every release.

Incident response
- Show SLO impact during incidents.
- Record bad-event count.
- Record budget consumed.
- Record burn rate.
- Identify affected SLI.
- Confirm whether users actually experienced the measured failure.
- Review SLO behavior after recovery.

Postmortems
- Record how much budget the incident consumed.
- Identify dominant failure class.
- Prioritize repeated causes.
- Add reliability actions where justified.
- Review whether the SLI captured impact correctly.
- Review alert timing.
- Update runbook.
- Avoid redefining the SLO only to hide the incident.

Dependencies
- Identify upstream SLOs where known.
- Understand weaker dependencies.
- Avoid relying on a dependency that cannot support your objective without mitigation.
- Add caching where appropriate.
- Add graceful degradation where appropriate.
- Add fallback where appropriate.
- Decouple synchronous dependencies where possible.
- Monitor dependency contribution to budget consumption.

Low-traffic services
- Check whether request ratios are statistically useful.
- Consider longer windows.
- Consider synthetic monitoring.
- Consider time-based availability.
- Avoid pages from one harmless failure among very few requests.
- Document low-volume behavior.

Monitoring implementation
- Export request counters.
- Export latency histograms.
- Preserve stable service labels.
- Preserve normalized route labels where useful.
- Avoid request IDs in metric labels.
- Avoid user IDs in metric labels.
- Build recording rules if calculations become expensive.
- Validate queries against known incidents.
- Monitor missing telemetry.

Dashboard
- Show service name.
- Show SLO target.
- Show current SLI.
- Show good events.
- Show bad events.
- Show total eligible events.
- Show budget consumed.
- Show budget remaining.
- Show burn rate.
- Show recent deployments.
- Show recent incidents.
- Link diagnostic dashboards.
- Keep the SLO view simple.

Documentation
- Document SLI specification.
- Document SLI implementation.
- Document SLO target.
- Document measurement window.
- Document eligible events.
- Document good-event classification.
- Document exclusions.
- Document error budget calculation.
- Document error budget policy.
- Document owner.
- Record approval date.
- Record next review date.

SLO review
- Review after major incidents.
- Review after architecture changes.
- Review after product changes.
- Review when traffic changes substantially.
- Review when user expectations change.
- Review when dependencies change.
- Review whether target is too loose.
- Review whether target is unnecessarily strict.
- Avoid changing objectives too frequently.

SLA relationship
- Keep internal SLO distinct from external SLA.
- Understand contractual consequences.
- Consider making internal SLO stricter than external commitment.
- Do not casually publish internal objectives as customer guarantees.
- Coordinate externally committed targets with business and legal stakeholders.

Small-team rollout
- Start with one critical service.
- Start with one critical journey.
- Define availability SLI.
- Define initial availability SLO.
- Add latency SLO when useful.
- Build one dashboard.
- Add one or two useful alerts.
- Write a lightweight error budget policy.
- Run the process for several weeks.
- Review real incidents.
- Improve definitions.
- Expand only when additional SLOs improve decisions.

Anti-patterns
- Do not target 100% by default.
- Do not start with dozens of SLOs.
- Do not use CPU utilization as the main user SLI.
- Do not use uptime of one server as application availability.
- Do not ignore requests that fail before reaching the app.
- Do not invent exclusions after incidents.
- Do not create SLOs nobody reviews.
- Do not create error budgets without policies.
- Do not page on every small SLO fluctuation.
- Do not choose targets only because competitors use them.
- Do not treat SLO violations as individual engineer failures.

Final review
- Does the SLI describe a user-relevant outcome?
- Can eligible events be counted reliably?
- Can good events be classified reliably?
- Is the measurement point close enough to the user?
- Is the SLO target realistic?
- Is the target valuable to users?
- Is the measurement window documented?
- Can the error budget be calculated?
- Is burn rate visible?
- Are alerts connected to budget consumption?
- Is there a written response when budget is exhausted?
- Can incidents be connected to budget loss?
- Does the SLO influence real engineering decisions?
- Is the SLO reviewed periodically?
14. FAQ
What is the difference between an SLI and an SLO?
An SLI is the measurement. An SLO is the target applied to that measurement over a defined time window. For example, the percentage of successful API requests is an SLI; achieving at least 99.9% successful requests over a rolling 30-day period is an SLO.
What is an error budget?
It is the amount of failure permitted by the objective. For a percentage-based 99.9% SLO, the error budget is 0.1% of eligible events during the measurement window.
Should my service have a 99.99% SLO?
Only when that level of reliability is justified by user expectations, business importance, dependency behavior, architecture, and cost. Higher reliability targets create smaller error budgets and usually require more engineering effort.
What is burn rate?
Burn rate describes how quickly the service is consuming the error budget relative to the sustainable rate across the complete SLO window. A high burn rate indicates that the budget could be exhausted rapidly if the current failure rate continues.
How many SLOs should a small team start with?
Start with one critical service and one or two user-facing objectives. Availability plus latency is often enough for a first implementation. Additional SLOs should represent distinct reliability requirements rather than additional dashboard metrics.
Is 100% reliability a good SLO?
Usually not. A 100% objective provides no explicit failure budget and can drive disproportionate engineering cost. The goal is to provide enough reliability for users and the business, not to maximize a percentage without considering tradeoffs.
Key terms (quick glossary)
- SRE
- Site Reliability Engineering, an engineering approach to operating reliable production systems using software practices, automation, measurement, explicit reliability objectives, and controlled risk.
- SLI
- Service Level Indicator, a quantitative measurement of a service outcome such as successful-request ratio, latency compliance, freshness, or correctness.
- SLO
- Service Level Objective, the target value an SLI should achieve over a defined measurement window.
- SLA
- Service Level Agreement, an agreement or external commitment concerning service performance, potentially including contractual or financial consequences.
- Eligible event
- An event included in the denominator of an SLI calculation, such as a production request belonging to the user journey being measured.
- Good event
- An eligible event that satisfies the defined reliability requirement, such as a successful request or one completed below a latency threshold.
- Error budget
- The permitted amount of unreliability implied by an SLO, commonly expressed as the difference between 100% and the target.
- Burn rate
- The rate at which an error budget is being consumed relative to the rate that would consume it evenly across the complete SLO window.
- Availability SLI
- An indicator describing the proportion of eligible service operations that successfully produce the expected available service behavior.
- Latency SLI
- An indicator describing the proportion of eligible operations that complete within a defined response-time threshold.
- Measurement window
- The time period over which SLI performance is compared with an SLO, such as a rolling 30-day interval.
- Error budget policy
- A documented set of engineering or operational actions taken when reliability consumes specified portions of the available error budget.
- Rolling window
- A measurement period that continuously moves forward with current time, always covering the most recent fixed duration.
- User journey
- A user-visible operation or sequence of operations whose successful completion represents meaningful product value, such as logging in or completing checkout.
Worth reading
Recommended guides from the category.