
Small teams often make one of two monitoring mistakes.
The first is having almost no monitoring and learning about outages from customers. The second is installing a large observability stack, importing hundreds of dashboards, creating dozens of alerts, and eventually ignoring most of them because nobody knows which signals actually matter.
A useful monitoring system sits between those extremes.
Its job is to answer a few operational questions quickly:
- Can users reach the service?
- Are requests succeeding?
- Is latency acceptable?
- Are critical dependencies working?
- Are we approaching dangerous resource limits?
- Who needs to respond when something breaks?
Monitoring is a response system
Collecting metrics is only the first layer. Production monitoring becomes useful when signals connect to dashboards, alerts connect to actions, alerts have owners, and the person receiving a page knows what to check next.
1. Start with the questions monitoring must answer
Before installing software, write down the services users actually depend on.
For a small web application, that might be:
public website
API
background worker
database
scheduled backup
email provider
Then separate the questions into three layers.
User-visible health
Can a user reach the application and complete the important operation?
Examples:
- Homepage responds successfully.
- Login endpoint is available.
- API error rate remains acceptable.
- Checkout completes.
Service behavior
What is happening inside the application?
- Request rate.
- Error rate.
- Latency.
- Queue depth.
- Database connection usage.
- Background job failures.
Infrastructure health
Does the system have enough capacity to continue operating?
- CPU.
- Memory.
- Filesystem capacity.
- Inodes.
- Disk I/O.
- Network errors.
User-visible metrics should generally drive urgent response. Internal metrics help explain the problem and warn about approaching capacity.
2. A minimal stack that can grow with you
Minimal monitoring stack architecture (diagram)
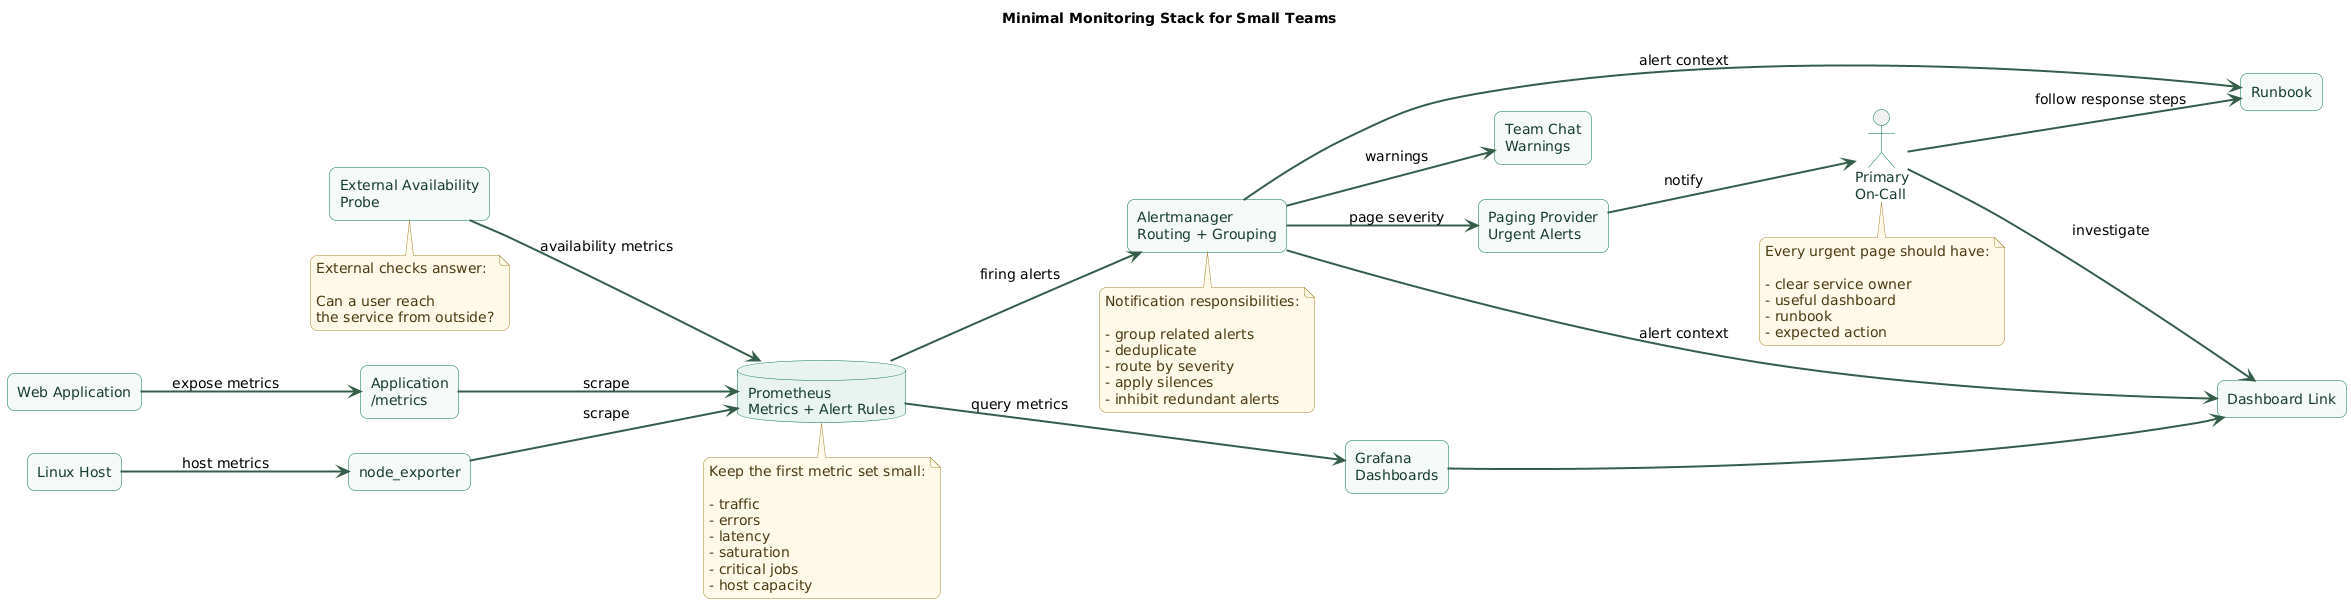
A practical open-source baseline can be surprisingly small:
Application /metrics ─┐
                      │
node_exporter ─────────┼──> Prometheus ───> Grafana
                      │        │
blackbox checks ──────┘        │
                               ▼
                         alert rules
                               │
                               ▼
                          Alertmanager
                           /         \
                          /           \
                       chat           page
                                       │
                                       ▼
                                    on-call
Prometheus
Prometheus stores time-series metrics and evaluates alerting rules.
It can scrape:
- Your application's metrics endpoint.
- Host-level exporters.
- Database exporters.
- Reverse proxies.
- Blackbox probes.
node_exporter
On ordinary Linux hosts, node exporter provides machine-level metrics such as CPU, memory, filesystems, disk devices, networking, and load.
You do not need to page on every one of these values. Their first purpose is often diagnosis.
Grafana
Grafana provides dashboards over your metrics.
For a small team, start with one service dashboard and one infrastructure dashboard instead of importing dozens of dashboards nobody understands.
Alertmanager
Prometheus determines whether an alert condition is active. Alertmanager manages how those alerts become notifications.
It can help with:
- Routing.
- Grouping.
- Deduplication.
- Silences.
- Inhibition.
External availability check
Internal monitoring can fail together with the application.
Add at least one check from outside the monitored service that verifies that the public endpoint is reachable.
Prometheus Blackbox Exporter can provide this within the same ecosystem, or you can use an independent external uptime service.
3. Collect the metrics that actually help
Start with a compact set of service signals rather than instrumenting everything.
Traffic
How much work is the service receiving?
http_requests_totalRequest rate provides context. Five errors during ten requests means something very different from five errors during one million requests.
Errors
Record failures in a way that allows an error ratio to be calculated.
sum(
  rate(
    http_requests_total{
      status=~"5.."
    }[5m]
  )
)
/
sum(
  rate(
    http_requests_total[5m]
  )
)
Latency
Use histograms when possible so latency can be evaluated across a distribution rather than only as an average.
histogram_quantile(
  0.95,
  sum by (le) (
    rate(
      http_request_duration_seconds_bucket[5m]
    )
  )
)
Averages can hide a painful slow tail.
Saturation
Watch resources that have hard or operational limits:
- Filesystem usage.
- Connection pool occupancy.
- Queue backlog.
- Worker saturation.
- Memory pressure.
Business-critical jobs
A healthy HTTP server does not mean the business process is healthy.
Monitor important scheduled work:
backup_last_success_timestamp_seconds
invoice_job_last_success_timestamp_seconds
email_queue_depth
failed_jobs_total
Keep label cardinality controlled
Avoid labels whose possible values grow without practical bounds:
# Dangerous label dimensions
user_id
email
request_id
full_url
session_id
Labels such as service, method, status class, region, or bounded endpoint names are usually more manageable.
Record metrics in application terms
Infrastructure tells you whether a machine is busy. Application metrics tell you whether that machine is doing useful work.
A server at 90% CPU that still serves every request quickly may be less urgent than a server at 30% CPU returning 40% errors.
4. Build dashboards for diagnosis, not decoration
A dashboard should answer operational questions in a useful order.
Top row: user impact
- Availability.
- Request volume.
- Error ratio.
- p50, p95, or p99 latency where useful.
Second row: application behavior
- Requests by endpoint.
- Error types.
- Worker throughput.
- Queue size.
- Database connection usage.
Third row: resources
- CPU.
- Available memory.
- Filesystem usage.
- Disk I/O.
- Network activity.
Add deployment context
When possible, annotate dashboards with deployments or other significant operational changes.
The difference between:
errors increased at 14:32and:
deployment at 14:31
errors increased at 14:32
can save substantial investigation time.
Default to useful time ranges
During an incident, responders commonly need:
- Last 15 minutes.
- Last hour.
- Last six hours.
- Comparison with previous day or week.
Avoid dashboards that require several minutes of manual configuration before the first useful graph appears.
5. Page on actionable symptoms
The easiest way to destroy trust in monitoring is to page people for conditions that require no immediate action.
Good paging candidates
- Public service is unavailable.
- Error rate is severely elevated for a sustained period.
- Latency makes an important workflow unusable.
- Critical scheduled processing has missed its operational deadline.
- A filesystem is approaching exhaustion quickly enough to threaten service.
Poor default paging candidates
- CPU above 80% for one minute.
- One container restarted.
- One individual request failed.
- Memory usage increased slightly.
- A non-critical background job retried once.
Those signals may still belong on dashboards or in lower-severity notifications.
Use duration to filter transient noise
groups:
  - name: api
    rules:
      - alert: ApiHighErrorRate
        expr: |
          (
            sum(rate(
              http_requests_total{
                service="api",
                status=~"5.."
              }[5m]
            ))
            /
            sum(rate(
              http_requests_total{
                service="api"
              }[5m]
            ))
          ) > 0.05
        for: 10m
        labels:
          severity: page
          service: api
          team: web
        annotations:
          summary: "API error rate above 5%"
          description: "The API has sustained elevated 5xx errors."
          dashboard: "https://grafana.example.com/d/api-overview"
          runbook: "https://docs.example.com/runbooks/api-errors"
The for duration prevents a brief threshold crossing from
immediately becoming a firing alert.
Use severity based on required response
severity: page
Immediate human response required.

severity: warning
Needs investigation during working hours.

severity: info
Usually belongs on a dashboard or event stream.
Severity should describe operational urgency, not how scary the metric name sounds.
Ask the actionability question
For every alert:
If this fires at 03:00, what should the responder actually do?
If there is no useful answer, it probably should not wake someone up.
6. Route, group, silence, and inhibit alerts
Alert severity and routing flow (diagram)
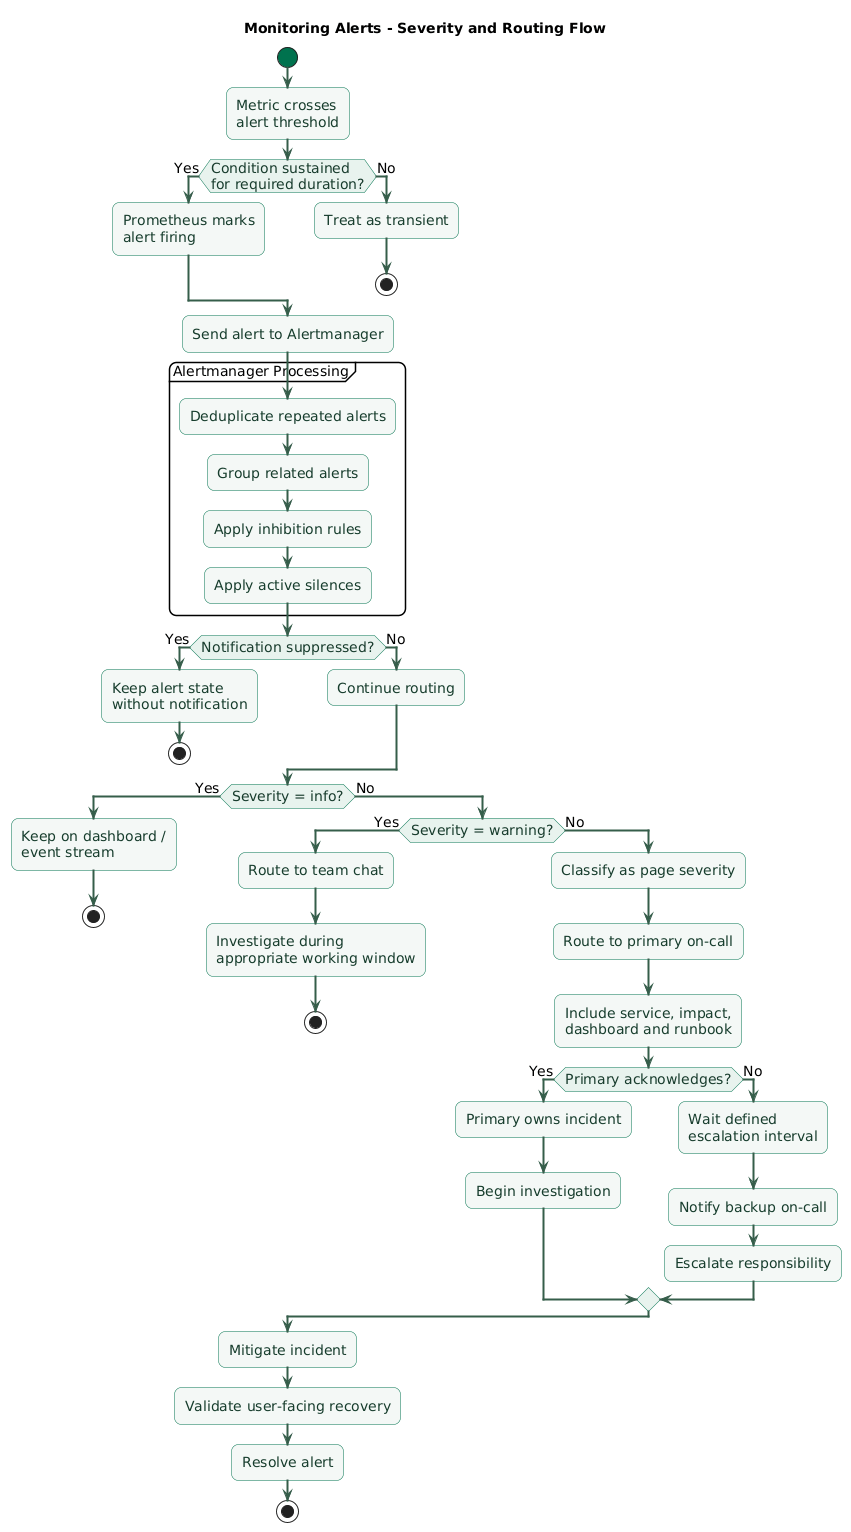
A monitoring system should not send every alert to every person.
Route by severity and ownership
A simple model:
warning + team=web
    ↓
#web-operations chat

warning + team=data
    ↓
#data-operations chat

page + team=web
    ↓
web on-call

page + team=data
    ↓
data on-call
Example Alertmanager structure
route:
  receiver: default-chat
  group_by:
    - alertname
    - service

  routes:
    - matchers:
        - severity="page"
      receiver: oncall

    - matchers:
        - severity="warning"
      receiver: team-chat
Group related alerts
If ten API instances all fail because the database is unavailable, ten independent pages do not create ten times more information.
Grouping lets related alerts become one operational notification while preserving the affected instances as context.
Use inhibition for downstream noise
Suppose the entire database cluster is unreachable.
That may trigger:
DatabaseUnavailable
ApiDatabaseErrors
WorkerDatabaseErrors
PaymentDatabaseErrors
ReportDatabaseErrors
If the database outage already explains those lower-level symptoms, inhibition can suppress redundant notifications while the parent problem is firing.
Use silences deliberately
Planned maintenance may legitimately trigger known alerts.
A silence should have:
- Narrow matchers.
- A clear owner.
- A reason.
- An expiration time.
Avoid broad silences that accidentally suppress unrelated incidents.
7. Attach context and runbooks
A page that says only:
CRITICAL: value = 0.943forces the responder to reconstruct what the alert author already knew.
Every paging alert should answer
- What service is affected?
- What symptom crossed the threshold?
- How long has it been happening?
- What user impact is expected?
- Which team owns the service?
- Which dashboard should I open?
- Which runbook should I follow?
Minimal runbook
# API High Error Rate

Impact:
Users may receive HTTP 5xx responses.

First checks:
1. Open API overview dashboard.
2. Confirm affected endpoints.
3. Check latest deployment.
4. Check application logs.
5. Check database availability.
6. Check upstream dependency errors.

Safe recovery:
- Roll back latest release if strongly correlated.
- Restart only the unhealthy instance if required.

Escalate when:
- Database appears affected.
- Multiple services are failing.
- Error rate remains above threshold after mitigation.

Links:
- Dashboard
- Logs
- Deployment history
- Service repository
The runbook does not need to solve every possible failure. It needs to get the first responder moving in the right direction.
Keep permissions ready before the incident
An on-call engineer should not discover at 03:00 that they cannot:
- Open production dashboards.
- Read application logs.
- View deployments.
- Access the incident channel.
- Perform documented recovery operations.
8. Establish simple on-call ownership
Small-team on-call incident loop (diagram)
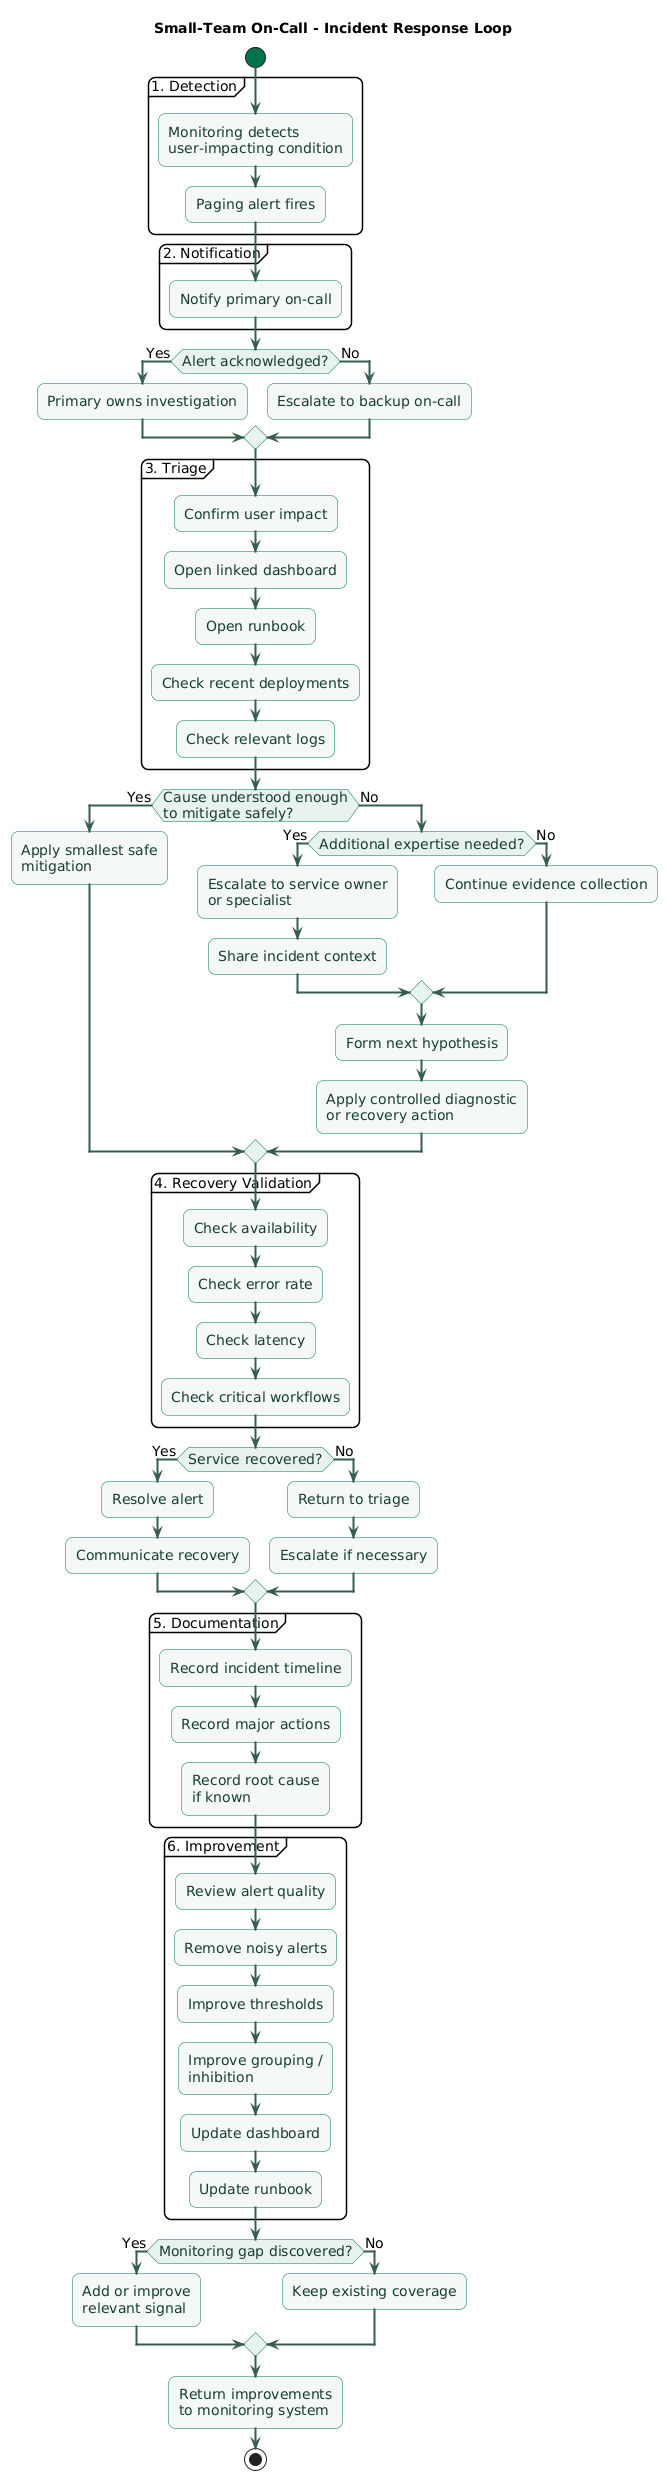
You do not need a large operations department to define on-call responsibilities.
You do need clarity.
Primary responder
One person is responsible for receiving and acknowledging urgent alerts during the assigned period.
Backup or escalation contact
There must be a documented path when:
- The primary does not acknowledge.
- The primary needs additional expertise.
- The incident affects several systems.
- The incident requires a risky production action.
Example escalation model
alert fires
    ↓
primary on-call notified
    ↓
acknowledged?
    ├── yes → investigate
    │
    └── no after defined window
            ↓
       notify backup
            ↓
       escalate further if needed
The exact timing depends on the service's criticality. The important part is that it is decided before the outage.
Define acknowledgement separately from resolution
Acknowledging means:
I saw the alert.
I own the investigation.
It does not mean the problem is fixed.
Keep handoffs explicit
When responsibility changes, communicate:
- Active incidents.
- Known degraded systems.
- Temporary silences.
- Risky deployments.
- Outstanding capacity concerns.
Protect the sustainability of the rotation
Frequent unnecessary pages are an engineering problem, not an expected cost of being on call.
If people receive repeated alerts that do not require action, remove or redesign those alerts.
A noisy alert is operational debt
Every false or unactionable page trains responders to trust the alerting system less. A small team is usually better served by ten reliable alerts than by one hundred alerts whose urgency is unclear.
9. Monitor the monitoring system
Monitoring infrastructure can fail.
If Prometheus stops scraping metrics or notifications stop leaving Alertmanager, silence may look like perfect health.
Check Prometheus itself
Monitor:
- Scrape failures.
- Missing targets.
- Rule evaluation failures.
- Storage availability.
- Monitoring host capacity.
Use an always-firing watchdog
- alert: Watchdog
  expr: vector(1)
  labels:
    severity: watchdog
  annotations:
    summary: "Monitoring alert pipeline watchdog"
A receiver can use this continuous signal to verify that the expected alerting pipeline remains alive.
Test notification delivery
Do not assume a configuration file proves paging works.
Periodically verify:
test alert
    ↓
Prometheus
    ↓
Alertmanager
    ↓
notification provider
    ↓
actual on-call device
    ↓
acknowledgement
Keep one monitor outside the monitored system
If your application, Prometheus, Grafana, and Alertmanager all run on one host, losing that host can remove both the service and its monitoring.
An independent external HTTP check provides a useful second perspective.
10. Review alerts after incidents
Every real incident provides data about your monitoring design.
Ask whether the alert fired at the right time
- Did users notice the incident before monitoring did?
- Did the alert fire too early?
- Did it fire too late?
- Was the duration appropriate?
Ask whether the page contained enough context
- Was the affected service obvious?
- Was the dashboard useful?
- Was the runbook current?
- Did the first responder know the next step?
Ask which alerts were noise
Large incidents frequently trigger cascades of secondary alerts.
Improve grouping or inhibition when five pages describe one underlying failure.
Measure alert quality
Keep lightweight operational statistics such as:
- Number of pages per week.
- Pages outside working hours.
- Percentage requiring real action.
- Repeated alerts for the same known problem.
- Alerts discovered to have no owner.
Graduate toward SLOs when useful
As the service matures, recurring availability and latency alerts can be connected to explicit service-level objectives and error budgets.
A small team does not need to begin with elaborate SLO mathematics, but it should eventually be able to define what “reliable enough” means from the user's perspective.
11. Copy/paste monitoring and on-call checklist
Minimal monitoring stack checklist

Monitoring goals
- List production services.
- Identify user-visible critical paths.
- Define what service unavailable means.
- Define important latency expectations.
- Define important error conditions.
- Identify scheduled jobs whose failure matters.
- Identify dependencies whose failure affects users.
- Identify capacity limits that could cause an outage.

Metrics platform
- Deploy a metric collector such as Prometheus.
- Configure persistent storage appropriate for the environment.
- Define a reasonable retention period.
- Protect the metrics service from unnecessary public exposure.
- Record configuration in source control.
- Back up important configuration.
- Document how monitoring is deployed.

Host metrics
- Collect CPU metrics.
- Collect load metrics.
- Collect memory metrics.
- Collect filesystem usage.
- Collect inode usage.
- Collect disk I/O metrics.
- Collect network metrics.
- Monitor host exporter availability.
- Do not automatically page on every infrastructure threshold.

Application metrics
- Expose request count.
- Expose response status information.
- Expose request latency.
- Use bounded labels.
- Avoid user IDs as metric labels.
- Avoid request IDs as metric labels.
- Avoid full URLs with unlimited paths as labels.
- Expose queue depth where relevant.
- Expose worker throughput where relevant.
- Expose dependency error counts.
- Expose connection-pool saturation where relevant.
- Expose business-critical job success timestamps.

Availability monitoring
- Monitor the service from outside the application process.
- Check the public endpoint.
- Validate HTTP status.
- Add TLS checks where appropriate.
- Check an important user path when practical.
- Keep at least one monitoring path independent of the monitored host.
- Define how long an availability failure must persist before paging.

Dashboards
- Create one service overview dashboard.
- Show traffic.
- Show error ratio.
- Show latency.
- Show availability.
- Show important saturation metrics.
- Show application-specific metrics.
- Show dependency health.
- Add infrastructure panels below user-facing metrics.
- Add deployment annotations when possible.
- Use useful default time ranges.
- Avoid decorative panels with no operational purpose.
- Link dashboards from alerts.

Alert design
- Alert primarily on actionable symptoms.
- Avoid alerting on every possible root cause.
- Avoid paging on one failed request.
- Avoid paging on one short CPU spike.
- Add a duration for transient conditions.
- Define expected responder action.
- Define severity.
- Define service.
- Define owner.
- Define team.
- Include meaningful summary.
- Include description.
- Include dashboard link.
- Include runbook link.
- Test the alert rule before relying on it.

Severity
- Define what qualifies as page severity.
- Define what qualifies as warning severity.
- Keep informational conditions on dashboards or low-noise channels.
- Base urgency on user impact and required response.
- Avoid assigning page severity only because a threshold looks high.
- Review severity after incidents.

Paging alerts
- Page for sustained service unavailability.
- Page for severe sustained error rates.
- Page for severe sustained latency where immediate action helps.
- Page for critical processing deadlines missed.
- Page for imminent resource exhaustion when intervention is required.
- Ensure pages are actionable.
- Remove pages that repeatedly require no action.

Warning alerts
- Route capacity warnings to working-hours channels where appropriate.
- Warn about growing disk usage before it becomes urgent.
- Warn about deteriorating dependency health.
- Warn about repeated job retries.
- Warn about approaching certificate expiration with enough lead time.
- Do not wake people for conditions that can safely wait.

Alertmanager
- Connect Prometheus alert rules to Alertmanager.
- Configure a default receiver.
- Route alerts by severity.
- Route alerts by team or ownership.
- Group related alerts.
- Configure sensible group timing.
- Deduplicate repeated notifications.
- Use inhibition where one parent outage explains many child alerts.
- Use silences for planned maintenance.
- Give silences expiration times.
- Scope silences narrowly.
- Test configuration changes.

Alert ownership
- Give every alert an owner.
- Give every monitored service an owner.
- Remove orphaned alerts.
- Update routing when team ownership changes.
- Ensure contact details remain current.
- Keep ownership labels consistent.

Runbooks
- Create a runbook for every paging alert.
- Describe expected impact.
- List first diagnostic checks.
- Link the correct dashboard.
- Link logs.
- Link deployment history.
- Link the service repository where useful.
- Document safe recovery actions.
- Document escalation conditions.
- Keep commands safe and copyable.
- Review runbooks after incidents.
- Remove obsolete instructions.

On-call
- Define a primary responder.
- Define a backup responder.
- Define escalation path.
- Define rotation schedule.
- Define acknowledgement expectations.
- Define handoff procedure.
- Ensure responders have required production access.
- Ensure responders can access dashboards.
- Ensure responders can access logs.
- Ensure responders can perform documented recovery operations.
- Keep emergency contacts current.

On-call sustainability
- Track page frequency.
- Track overnight pages.
- Track unactionable pages.
- Remove recurring noise.
- Fix repeatedly failing services instead of normalizing pages.
- Do not depend permanently on one person.
- Provide coverage for absence and illness.
- Review workload across the rotation.

Incident response
- Acknowledge the alert.
- Confirm user impact.
- Open the linked dashboard.
- Follow the runbook.
- Check recent deployments.
- Check relevant logs.
- Identify the most likely failing subsystem.
- Mitigate safely.
- Escalate when expertise or authority is missing.
- Validate recovery from user-facing signals.
- Document significant actions.
- Record incident timeline.

Notification testing
- Trigger controlled test alerts.
- Verify Prometheus evaluates the rule.
- Verify Alertmanager receives the alert.
- Verify routing chooses the correct receiver.
- Verify the notification provider receives it.
- Verify the on-call device receives it.
- Verify acknowledgement works.
- Repeat testing after major routing changes.
- Test backup escalation.

Meta-monitoring
- Monitor Prometheus availability.
- Monitor scrape failures.
- Monitor missing targets.
- Monitor rule evaluation failures.
- Monitor Alertmanager availability.
- Use an alert-pipeline watchdog where appropriate.
- Monitor monitoring-host capacity.
- Keep external availability monitoring independent.
- Detect when telemetry disappears unexpectedly.

Storage and retention
- Define metric retention.
- Monitor monitoring-disk usage.
- Avoid allowing Prometheus storage to fill the host.
- Understand backup requirements.
- Preserve enough history for incident investigation.
- Revisit retention as metric volume grows.

Security
- Do not expose monitoring interfaces publicly without protection.
- Restrict administrative access.
- Protect notification credentials.
- Store secrets outside version-controlled plain-text configuration.
- Use TLS where appropriate.
- Keep monitoring software patched.
- Review integrations and tokens periodically.
- Give responders only required privileges.

Alert fatigue
- Review alerts that fire frequently.
- Remove alerts with no action.
- Increase duration where brief spikes are harmless.
- Improve thresholds based on observed behavior.
- Group duplicate alerts.
- Inhibit secondary alerts during parent failures.
- Downgrade non-urgent alerts.
- Fix persistent underlying problems instead of silencing forever.

Post-incident review
- Did monitoring detect the incident?
- Did it detect the correct symptom?
- Did the alert fire soon enough?
- Did it fire too early?
- Was severity correct?
- Did the correct person receive it?
- Was the dashboard useful?
- Was the runbook useful?
- Were there duplicate pages?
- Did inhibition work?
- Was escalation needed?
- Were important metrics missing?
- Should an alert be added?
- Should an alert be removed?
- Should a threshold change?
- Should a runbook change?

Growth
- Add complexity only when requirements justify it.
- Add centralized logs when logs become difficult to investigate.
- Add tracing when cross-service requests become difficult to follow.
- Add more advanced SLO alerting when service objectives are mature.
- Add high availability to monitoring when monitoring downtime is unacceptable.
- Avoid deploying observability components that nobody will maintain.

Final review
- Can you tell whether users can reach the service?
- Can you see request errors and latency?
- Can you diagnose basic host capacity problems?
- Can you detect important job failures?
- Does an urgent alert reach a real person?
- Does every page have an action?
- Does every page have an owner?
- Does every page link to a dashboard?
- Does every page have a runbook?
- Is there a backup escalation path?
- Can you detect failure of the monitoring system itself?
- Have you tested the entire alert path recently?
12. FAQ
What is the minimum monitoring stack a small team actually needs?
Collect application and host metrics, retain enough history for investigation, provide a useful dashboard, add at least one external availability check, evaluate a small number of actionable alert rules, and route urgent alerts to a clearly responsible person.
Should high CPU usage page the on-call engineer?
Usually not by itself. CPU is often a diagnostic or capacity signal. Prefer paging on sustained user-visible symptoms or on resource exhaustion that is sufficiently imminent to require immediate human intervention.
What should every paging alert contain?
Include the affected service, clear symptom, severity, owner, expected impact, dashboard link, runbook link, and enough context for the first responder to begin investigation.
What is the difference between Prometheus and Alertmanager?
Prometheus collects metrics and evaluates alert conditions. Alertmanager receives resulting alerts and controls notification behavior such as grouping, deduplication, routing, silencing, and inhibition.
Why should I use an external uptime check?
Internal monitoring can fail together with the system it monitors. An independent check from outside the application's environment can detect failures that internal metrics cannot report.
How many alerts should a small team have?
There is no universal number. Start with a small set covering severe availability, error, latency, critical-job, and capacity conditions. Expand only when an alert identifies a real operational gap and has a clear response.
Key terms (quick glossary)
- Metric
- A numerical measurement recorded over time, such as request count, latency, memory usage, or filesystem capacity.
- Prometheus
- A time-series monitoring system commonly used to scrape metrics, evaluate PromQL queries, and execute alerting rules.
- Grafana
- A visualization and observability platform commonly used to create dashboards from Prometheus and other data sources.
- Alertmanager
- The Prometheus alert-notification component responsible for routing, grouping, deduplication, silences, inhibition, and delivery to receivers.
- node_exporter
- A Prometheus exporter providing Linux and Unix host metrics such as CPU, memory, filesystem, disk, and networking statistics.
- Blackbox monitoring
- Monitoring performed from the outside of a service to verify observable behavior such as HTTP availability, TCP connectivity, DNS, or TLS.
- Alert rule
- A condition evaluated against monitoring data that becomes an alert when its expression and optional duration requirements are satisfied.
- Silence
- A temporary Alertmanager rule suppressing notifications matching specified labels, commonly used during planned maintenance.
- Inhibition
- Suppression of one class of alert notifications while another related alert is firing, often used to reduce downstream noise during a larger failure.
- Runbook
- A concise operational guide describing how to investigate and respond to a known alert or failure scenario.
- On-call
- An operational responsibility in which a designated responder receives and handles urgent production incidents during an assigned period.
- Escalation
- The process of involving another responder, service owner, or authority when an incident is unacknowledged or requires additional expertise.
- Alert fatigue
- Reduced responder attention and trust caused by frequent noisy, duplicate, false, or unactionable alerts.
- SLO
- Service Level Objective, a defined reliability target for a measurable service indicator such as availability or latency.
Worth reading
Recommended guides from the category.