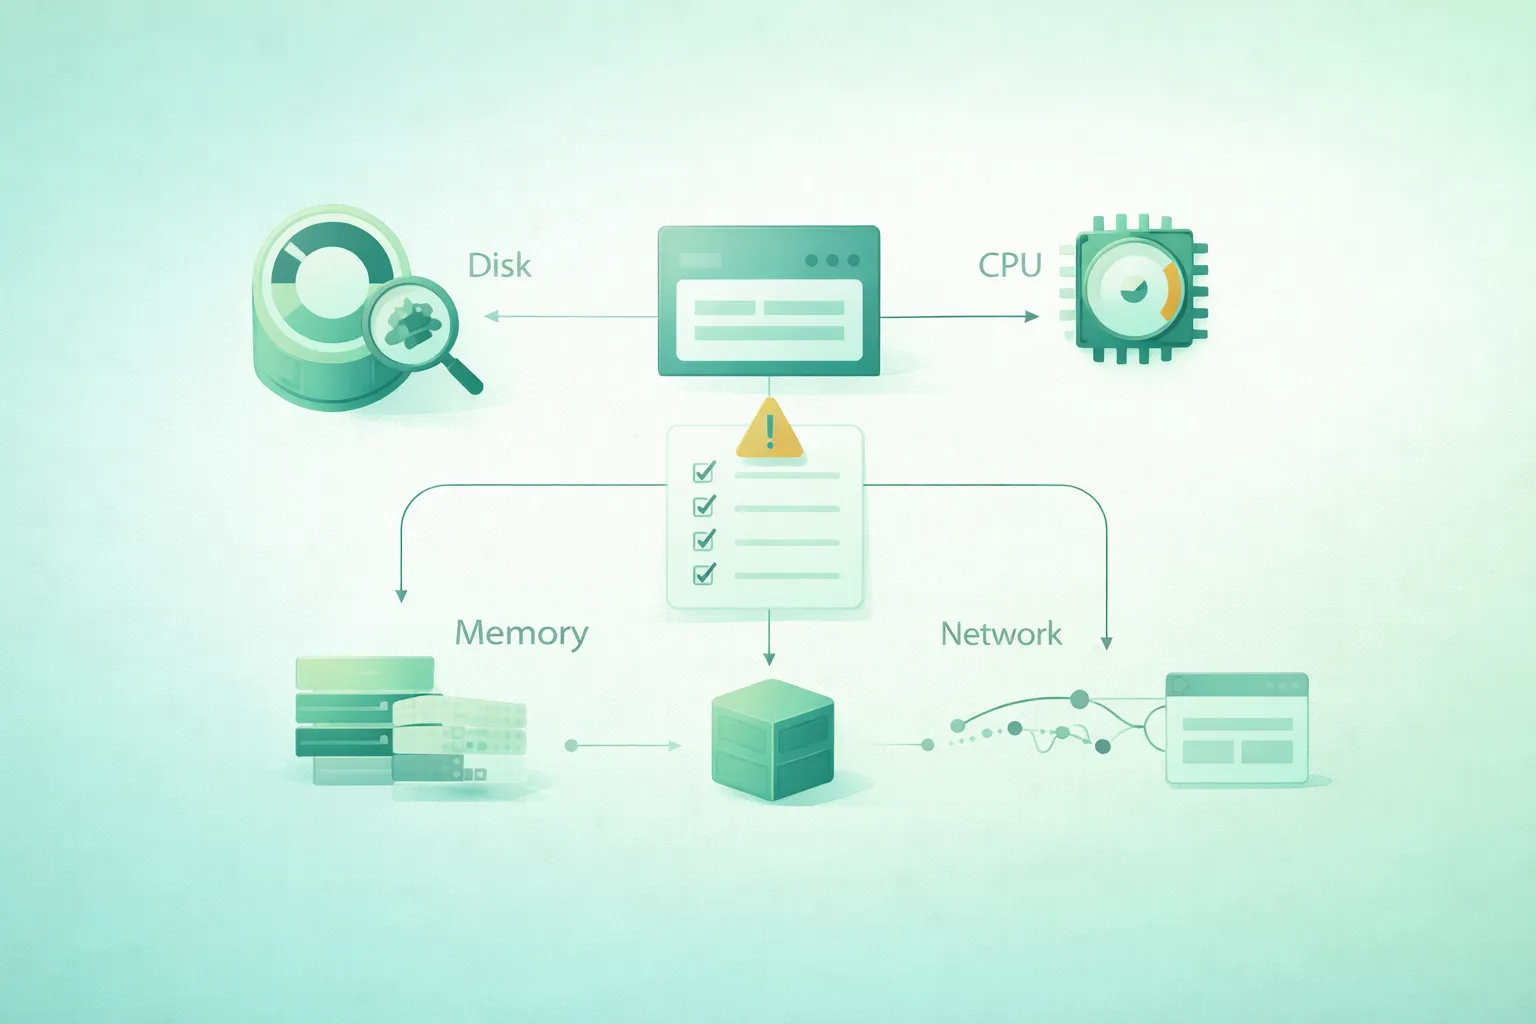
A Linux server is slow. Requests are timing out. SSH still works, but the application does not. Disk usage looks suspicious. Load average is 18. Someone suggests restarting everything.
This is where troubleshooting discipline matters.
Disk exhaustion, CPU saturation, blocked disk I/O, memory pressure, swapping, DNS failures, broken routes, connection exhaustion, and a single failed application process can all produce similar user-visible symptoms.
The objective is therefore not to run as many commands as possible. It is to narrow the problem from:
something is broken
        ↓
which subsystem?
        ↓
which resource / service?
        ↓
which process / dependency?
        ↓
what changed?
        ↓
what is the safest corrective action?
Collect evidence before changing the system
A restart can remove the symptom while also destroying the state that would have explained it. During an active incident, capture process, resource, socket, and log evidence before making disruptive changes when the situation allows.
1. Start with scope, time, and evidence
Linux first-response troubleshooting flow (diagram)

Before focusing on one resource, define the incident.
Ask five questions
- What exactly is failing?
- When did it begin?
- Is the problem constant or intermittent?
- Which hosts, services, users, or regions are affected?
- What changed shortly before the failure?
“The server is slow” is not enough.
A better incident statement is:
Since approximately 14:32 UTC,
API requests on app-02 exceed 5 seconds.

app-01 remains healthy.

The database is reachable.

A deployment completed on app-02 at 14:27 UTC.
That already suggests a much narrower investigation.
Record the current time
date --iso-8601=secondsPrecise timestamps make it easier to align application errors, kernel messages, deployments, monitoring alerts, and user reports.
Check uptime and load
uptimeExample:
16:11:03 up 34 days,  4:12,
2 users,
load average: 7.82, 6.40, 3.91
Load averages summarize recent system load over approximately 1, 5, and 15 minutes.
Do not interpret a load of 8 without context. Eight runnable or blocked tasks on a 32-CPU host is a different situation from eight on a single-vCPU virtual machine.
Count CPUs
nprocLoad average is a clue, not a diagnosis.
2. Run a fast system-wide triage
Before diving deeply into one subsystem, take a broad snapshot.
uptime

df -hT
df -ih

free -h

vmstat 1 6

ps -eo pid,ppid,user,stat,%cpu,%mem,rss,comm \
  --sort=-%cpu | head -20

ss -s

systemctl --failed

journalctl -p warning --since "-15 min" --no-pager
Not every distribution includes every optional utility used later in this guide, but these commands provide a useful starting point on many common Linux systems.
Why broad triage first?
Suppose the application appears CPU-bound, but you immediately discover:
/var 100% full
Or perhaps memory appears low, but vmstat shows several
blocked processes and heavy disk wait.
Looking at related subsystems prevents premature conclusions.
3. Disk: capacity, inodes, large files, and I/O
“Disk problem” can mean several different things:
- The filesystem is out of data blocks.
- The filesystem is out of inodes.
- A mount disappeared or became read-only.
- A deleted file is still held open.
- One process is generating excessive writes.
- The storage device is experiencing high latency.
Check filesystem capacity
df -hTPay attention to:
Use%.- The filesystem type.
- The actual mount point.
- Unexpected or missing mounts.
Check the specific path if the problem concerns one service:
df -hT /var/lib/myappCheck inode consumption
df -ihA filesystem can have free storage capacity and still fail to create files when its inode supply is exhausted.
This commonly happens when an application creates huge numbers of small files.
Find which directory consumes space
sudo du -xhd1 /var | sort -hThen descend into a suspicious directory:
sudo du -xhd1 /var/log | sort -h
The -x option keeps the scan on one filesystem, which helps
prevent unintentionally walking into mounted filesystems.
Find unusually large files
sudo find /var \
  -xdev \
  -type f \
  -size +1G \
  -printf '%s %p\n' \
  2>/dev/null \
  | sort -n
Watch for deleted but still-open files
A process can keep a file descriptor open after the file has been deleted. The pathname disappears, but the filesystem space cannot be reclaimed until the descriptor closes.
If lsof is installed:
sudo lsof +L1A large deleted logfile still owned by a running process can explain why:
du says:
30 GB

df says:
95 GB used
Do not immediately kill the process. Determine whether it can reopen the file safely, reload logs, or restart with controlled impact.
Check mount state
findmntFor one path:
findmnt -T /var/lib/myappDisk capacity is not disk performance
A filesystem can be 40% full and still be painfully slow.
If the optional sysstat utilities are installed:
iostat -xz 1Look for sustained latency, queueing, throughput saturation, and device utilization rather than relying on one field in isolation.
Find I/O-heavy processes
If available:
pidstat -d 1This can connect device-level pressure to a particular process.
4. CPU and load: saturation or waiting?
Linux resource bottleneck decision tree (diagram)
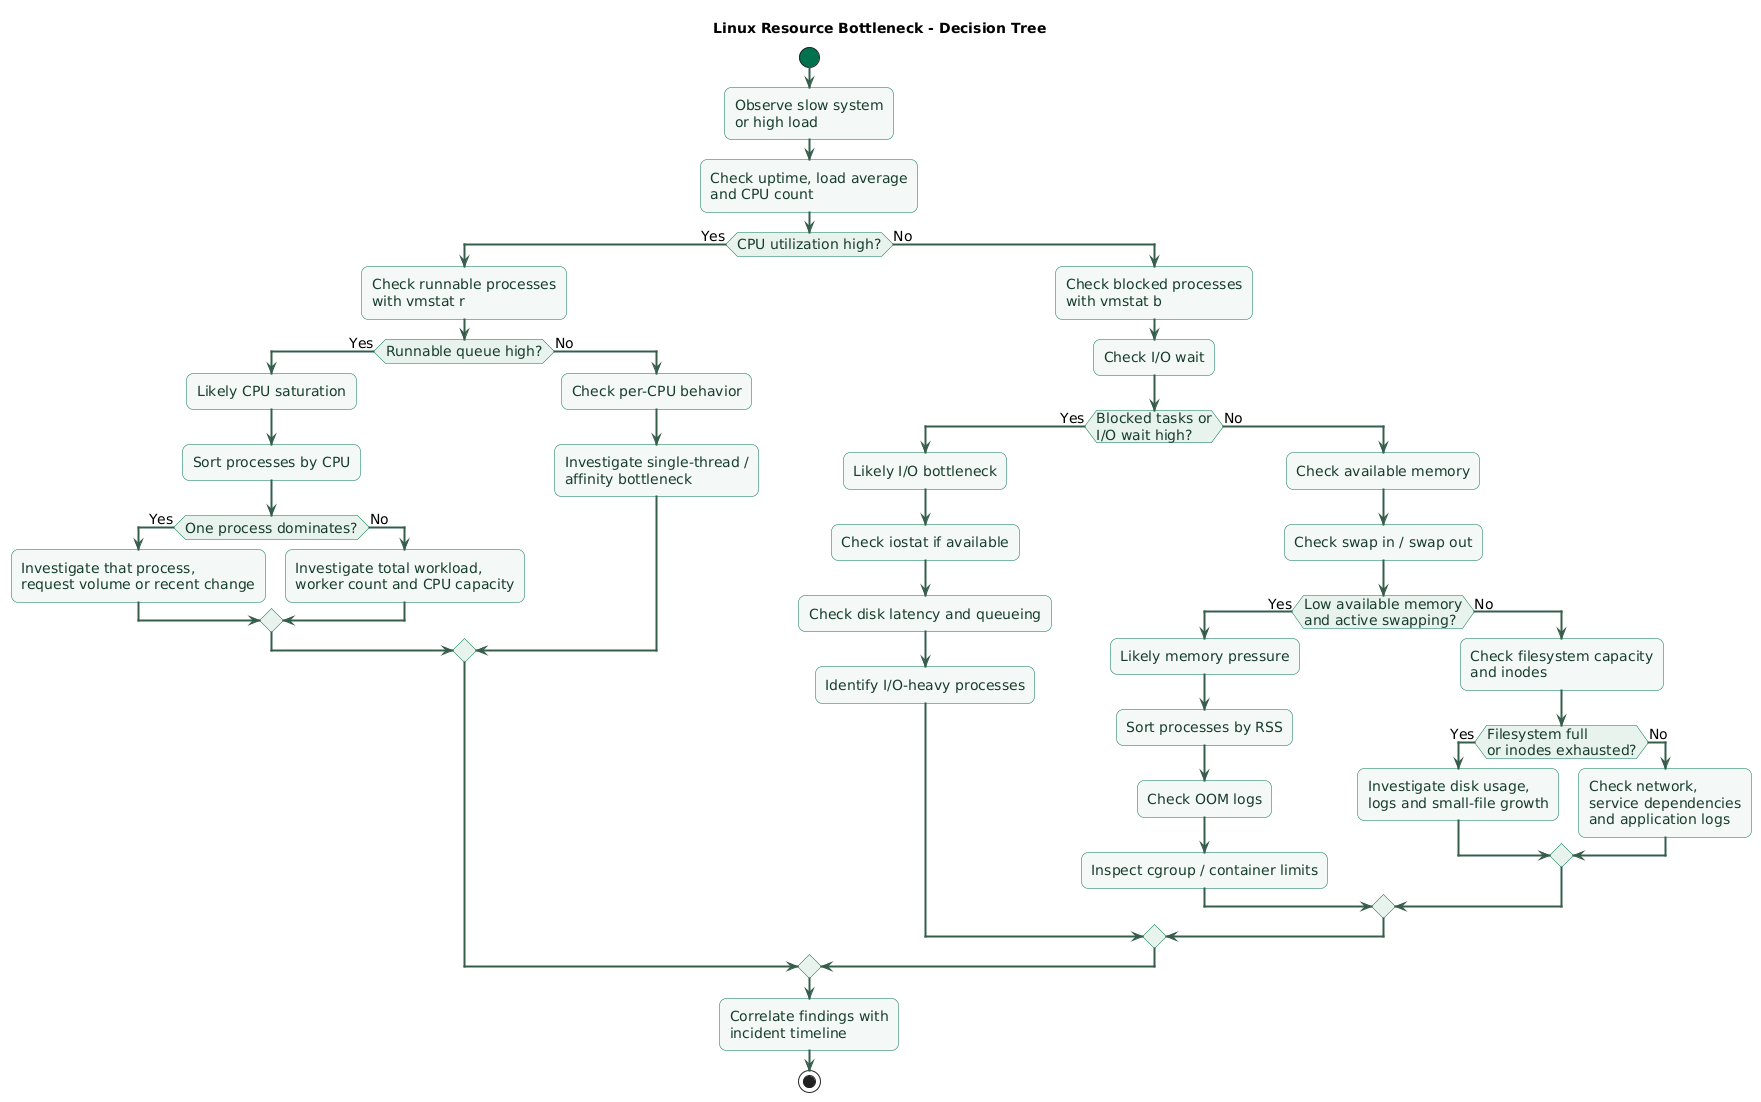
High load does not automatically mean high CPU usage.
Find CPU-heavy processes
ps -eo \
pid,ppid,user,stat,%cpu,%mem,etime,comm \
--sort=-%cpu \
| head -20
Look for:
- One runaway process.
- Many workers simultaneously consuming CPU.
- A newly started process.
- Unexpected commands.
Use top for an interactive view
topObserve whether CPU time is concentrated in user processes, kernel work, or waiting behavior.
Use vmstat to distinguish pressure types
vmstat 1 6
vmstat reports processes, memory, paging, block I/O, and CPU
activity together.
The first row usually represents statistics averaged since boot. The later rows represent the requested sampling interval and are more useful for current troubleshooting.
Important vmstat fields
r   runnable processes
b   processes blocked on I/O

si  swap in
so  swap out

us  user CPU
sy  system CPU
id  idle CPU
wa  I/O wait
Pattern: CPU saturation
r: consistently high
id: near zero
us + sy: high
This points toward CPU demand exceeding available processor capacity.
Pattern: storage or I/O problem
load average: high
CPU idle: significant
b: elevated
wa: elevated
Processes may be waiting rather than actively executing.
Check per-CPU behavior
If mpstat is installed:
mpstat -P ALL 1This can reveal one saturated CPU while the overall average still looks moderate.
Inspect process threads when necessary
ps -L -p PID \
  -o pid,tid,psr,stat,%cpu,comm
A multithreaded application can have one thread behaving very differently from the rest.
Do not kill a high-CPU process only because it is first in top
A busy database, compression worker, backup, or application process may be doing legitimate work. Determine why CPU demand increased and what dependency or workload triggered it before terminating production processes.
5. Memory, swap, and OOM troubleshooting
Start with free
free -hExample columns include:
total
used
free
shared
buff/cache
available
Do not treat a small free value alone as an emergency.
Linux uses otherwise idle RAM for caches and can reclaim portions when
applications need memory. The available estimate is usually
more useful for answering:
How much memory can applications likely obtain without significant swapping?
Find large memory consumers
ps -eo \
pid,user,%mem,rss,vsz,etime,comm \
--sort=-rss \
| head -20
RSS represents resident memory associated with a process and
is often more useful than merely sorting by virtual address space.
Watch memory dynamically
vmstat 1 10Pay particular attention to:
available memory
swap used
si
so
blocked processes
Swap usage is not automatically an incident
Some pages can remain in swap even after memory pressure has disappeared.
More concerning is sustained active swapping during application latency:
si: repeatedly non-zero
so: repeatedly non-zero
Combined with low available memory and slow applications, this can point toward real memory pressure.
Check swap devices
swapon --showLook for OOM kills
journalctl -k \
  --since "-2 hours" \
  --no-pager \
  | grep -Ei \
  'out of memory|oom|killed process'
Kernel OOM messages can explain an application that vanished without a normal application-level shutdown.
Inspect one process in detail
grep -E \
'VmRSS|VmSize|VmSwap|Threads' \
/proc/PID/status
Memory leak pattern
One snapshot rarely proves a memory leak.
Look for a time series such as:
10:00 RSS 600 MB
11:00 RSS 900 MB
12:00 RSS 1.3 GB
13:00 RSS 1.8 GB
14:00 RSS 2.4 GB
Correlate growth with workload, request volume, caches, queues, and deployments.
6. Network: interface to application
Linux network troubleshooting path (diagram)
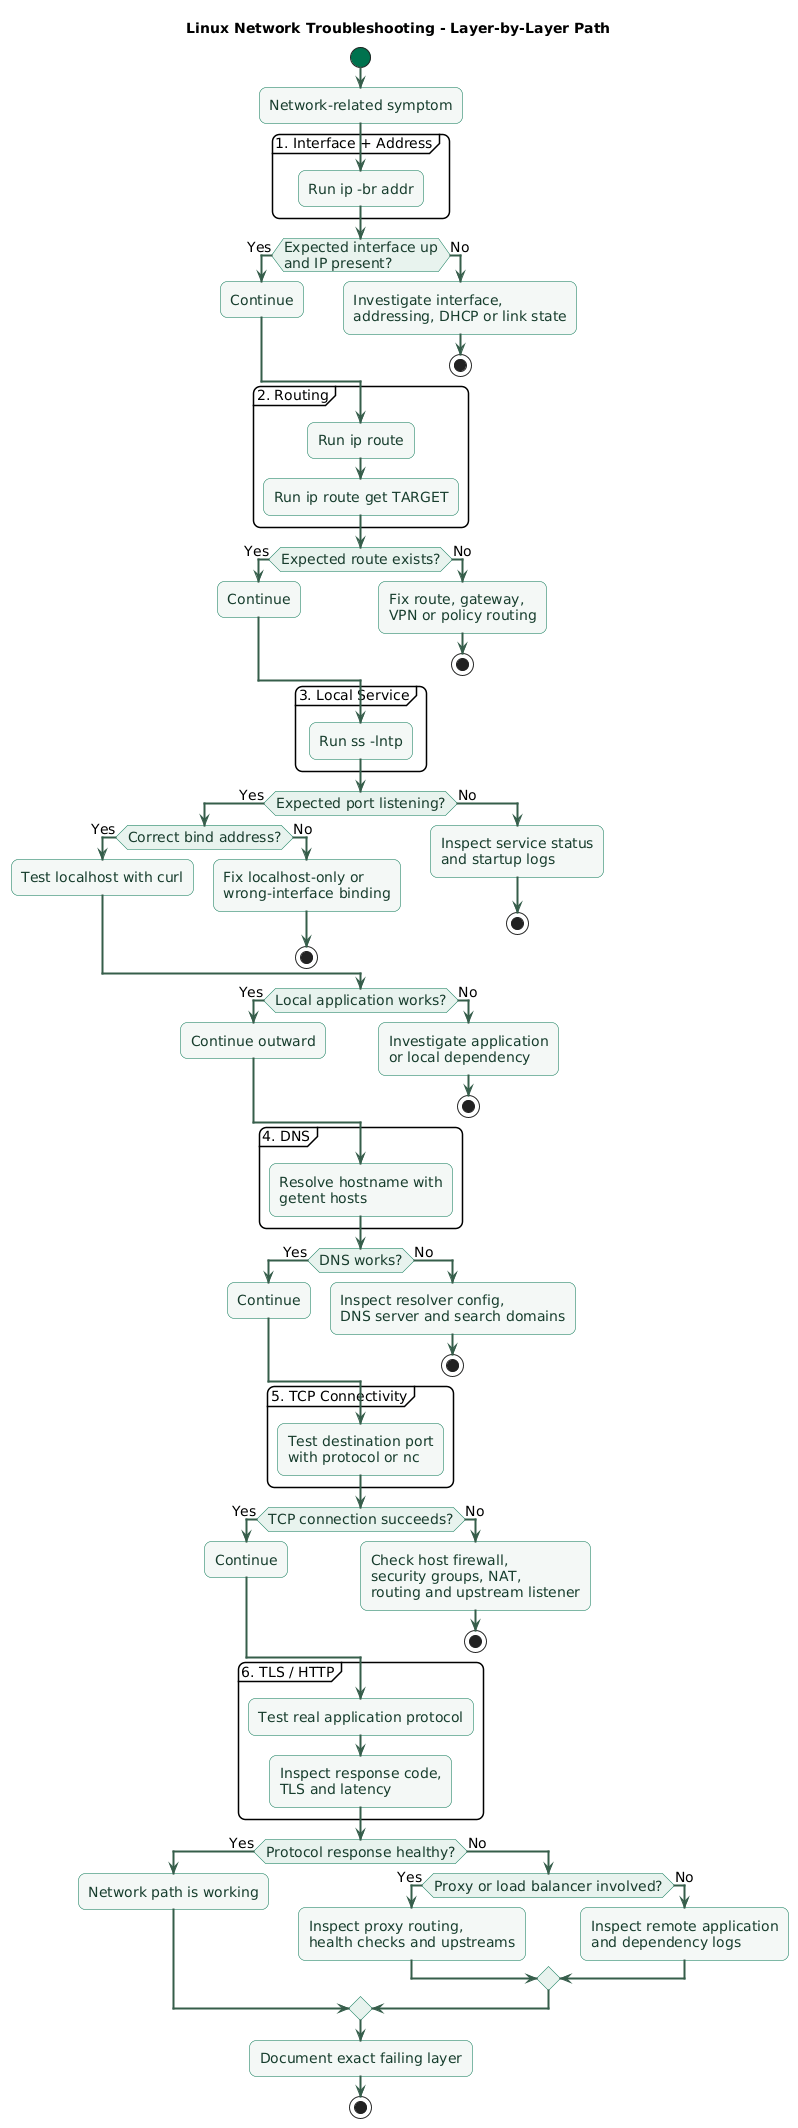
Network troubleshooting is easiest when performed layer by layer.
interface
   ↓
address
   ↓
route
   ↓
listening socket
   ↓
IP connectivity
   ↓
DNS
   ↓
TCP port
   ↓
TLS / HTTP
   ↓
application dependency
Check interfaces and addresses
ip -br addrVerify:
- The expected interface is up.
- The expected IPv4 or IPv6 address exists.
- No unexpected interface state changed.
Check routing
ip routeFor one target:
ip route get 1.1.1.1This helps identify which route, interface, and source address Linux plans to use.
Check whether the application is listening
ss -lntpFor UDP listeners:
ss -lnupIf the application should serve TCP port 8080:
ss -lntp | grep ':8080'Binding address matters
These are not equivalent:
127.0.0.1:8080
0.0.0.0:8080
10.0.2.15:8080
A service bound only to localhost may work locally while being completely unreachable from another host.
Summarize socket state
ss -sA sudden accumulation of particular TCP states can be useful evidence when investigating connection pressure.
Test local application connectivity
curl -v \
  http://127.0.0.1:8080/health
If localhost succeeds but remote clients fail, the problem likely lies after the application process:
- Binding address.
- Host firewall.
- Container network.
- Reverse proxy.
- Load balancer.
- External routing.
Separate DNS from connectivity
getent hosts example.comIf name resolution fails but connecting directly to a known IP succeeds, investigate DNS rather than the application protocol.
On systems using systemd-resolved, this can also be useful:
resolvectl statusTest TCP connectivity to a dependency
If netcat is installed:
nc -vz database.example.internal 5432Or test through the real protocol when practical.
Ping is not the whole network test
ping -c 4 10.0.0.10ICMP can be filtered while TCP services work normally. Conversely, a host responding to ping does not prove that your application port or upstream service is healthy.
7. Services and logs: correlate failures with time
Find failed systemd units
systemctl --failedInspect one service
systemctl status myapp.service \
  --no-pager
Look for:
- Current state.
- Main PID.
- Exit status.
- Restart loops.
- Recent log lines.
Read service logs around the incident
journalctl \
  -u myapp.service \
  --since "2026-08-23 14:20:00" \
  --until "2026-08-23 14:50:00" \
  --no-pager
Time-bounded searches are usually more useful than scrolling through the complete historical journal.
Inspect recent high-priority messages
journalctl \
  -p err \
  --since "-1 hour" \
  --no-pager
Inspect kernel messages
journalctl \
  -k \
  --since "-1 hour" \
  --no-pager
Kernel logs can reveal:
- OOM events.
- Storage errors.
- Filesystem problems.
- Network-interface changes.
- Driver or hardware warnings.
Correlate logs instead of reading them in isolation
For example:
14:31 deployment completed

14:32 new worker started

14:33 memory usage begins rising

14:36 swap activity starts

14:38 OOM killer terminates worker

14:38 API returns 502 errors
The timeline explains more than any individual error line.
8. Distinguish the real bottleneck
Several common symptoms overlap. Use combinations of observations rather than one metric.
| Observed pattern | Likely direction |
|---|---|
| High load, CPU busy, many runnable tasks | CPU saturation or excessive runnable work |
| High load, CPU partly idle, blocked tasks, I/O wait | Storage or another blocking I/O dependency |
| Low available RAM, active swap-in/out, latency | Memory pressure |
| Process disappeared plus kernel OOM event | Out-of-memory termination |
| Filesystem below 100% capacity but writes fail | Check inodes, read-only state, permissions, quotas |
| Local HTTP works but remote HTTP fails | Binding, routing, firewall, proxy, or load-balancer path |
| IP connectivity works but hostname lookup fails | DNS configuration or resolver dependency |
| Port accepts TCP but application returns errors | Application or downstream dependency |
Use process state as another clue
ps -eo pid,stat,wchan:30,commProcess states and wait channels can help determine whether tasks are running, sleeping, or blocked inside kernel operations.
Inspect a suspicious PID
ps -p PID \
  -o pid,ppid,user,stat,%cpu,%mem,rss,vsz,lstart,etime,args
Then connect that process to its open sockets:
ss -ntp
Or its open files when lsof is available:
sudo lsof -p PIDTroubleshooting becomes much faster when resource symptoms are connected to concrete processes.
9. Avoid destructive troubleshooting shortcuts
Do not reboot first
A reboot may temporarily resolve:
- A memory leak.
- A stuck process.
- A full temporary filesystem.
- A bad connection state.
It can also remove the evidence explaining the root cause.
Reboot when operational recovery requires it, but collect evidence first when possible.
Do not delete files blindly
rm -rf /var/log/*This can remove valuable evidence, break expected file ownership or paths, and may not recover space if processes still hold deleted files open.
Do not drop Linux caches as a generic memory fix
Filesystem cache is normally useful. Forcing cache eviction can reduce performance and does not fix an application memory leak.
Do not disable the firewall only to test networking
Inspect the relevant rules and paths instead. Broadly disabling a production security boundary can create a larger incident.
Do not change several things simultaneously
If you:
restart app
restart database
change firewall
delete logs
resize VM
and the incident disappears, you still do not know which change mattered.
Prefer:
observe
   ↓
form hypothesis
   ↓
make one controlled change
   ↓
measure result
   ↓
continue or revert
Recovery and root-cause analysis are different goals
During a severe outage, restoring service may take priority over perfect diagnosis. Record what evidence was captured, exactly which recovery actions were taken, and which questions remain for the follow-up investigation.
10. A reusable first-response command set
The following sequence provides a practical snapshot without immediately changing system state:
# Timestamp and host
date --iso-8601=seconds
hostnamectl 2>/dev/null || hostname

# Uptime and load
uptime
nproc

# Filesystems
df -hT
df -ih
findmnt

# Memory
free -h
swapon --show

# Combined CPU / memory / I/O snapshot
vmstat 1 6

# Top CPU consumers
ps -eo pid,ppid,user,stat,%cpu,%mem,rss,etime,comm \
  --sort=-%cpu \
  | head -20

# Top resident-memory consumers
ps -eo pid,ppid,user,stat,%cpu,%mem,rss,etime,comm \
  --sort=-rss \
  | head -20

# Interfaces and routes
ip -br addr
ip route

# Socket summary and listeners
ss -s
ss -lntup

# Failed services
systemctl --failed

# Recent important logs
journalctl -p warning --since "-15 min" --no-pager

# Recent kernel logs
journalctl -k --since "-15 min" --no-pager
Optional tools worth having
Depending on distribution and environment, useful additional packages include tools providing:
iostat.mpstat.pidstat.lsof.nc.dig.tracerouteortracepath.tcpdumpfor deeper packet-level diagnostics.
Install diagnostic tooling deliberately rather than downloading random utilities onto a production server in the middle of an incident.
11. Copy/paste Linux troubleshooting checklist
Linux troubleshooting playbook

Incident scope
- Record the current timestamp.
- Record the affected hostname.
- Define the user-visible symptom.
- Identify affected services.
- Identify affected hosts.
- Determine when the problem started.
- Determine whether it is continuous or intermittent.
- Identify recent deployments.
- Identify recent configuration changes.
- Identify infrastructure changes.
- Record monitoring alerts.
- Avoid changing the system before basic evidence is captured.

Initial system state
- Run uptime.
- Record the 1-minute load average.
- Record the 5-minute load average.
- Record the 15-minute load average.
- Count available CPUs.
- Run systemctl --failed.
- Inspect recent warning and error logs.
- Check kernel messages.
- Record whether the host recently rebooted.

Disk capacity
- Run df -hT.
- Check the affected mount specifically.
- Look for filesystems near capacity.
- Confirm expected mounts exist.
- Check filesystem type.
- Look for unexpectedly read-only mounts.
- Compare current usage with normal baseline.
- Do not delete files before identifying the source of growth.

Inodes
- Run df -ih.
- Check inode usage on affected filesystems.
- Investigate directories containing huge numbers of small files.
- Check temporary-file directories.
- Check cache directories.
- Check queue or spool directories.
- Check session storage.
- Check application-generated file trees.

Directory usage
- Use du on the relevant filesystem.
- Keep scans on one filesystem with -x when appropriate.
- Start at a high-level directory.
- Descend only into suspicious branches.
- Compare application data with log data.
- Check container data directories when relevant.
- Check package caches.
- Check backups and temporary artifacts.

Large files
- Search the affected filesystem for unexpectedly large files.
- Check application logs.
- Check core dumps.
- Check database dumps.
- Check temporary exports.
- Check failed backup artifacts.
- Check uncompressed archives.
- Record file ownership and timestamps before deleting anything.

Deleted open files
- Compare df and du when usage appears inconsistent.
- Use lsof +L1 when lsof is available.
- Identify which process holds deleted files.
- Identify the size of the deleted file.
- Determine whether the process can reopen logs safely.
- Prefer controlled reload or restart over arbitrary termination.

Disk I/O
- Run vmstat during the incident.
- Inspect blocked process counts.
- Inspect I/O wait.
- Use iostat -xz when available.
- Look for sustained storage latency.
- Look for queueing.
- Identify saturated devices.
- Use pidstat -d when available.
- Identify which processes are reading or writing heavily.
- Check whether backups or batch jobs overlap the incident.

CPU
- Compare load average with CPU count.
- Use top for live process activity.
- Sort processes by CPU.
- Record the top CPU-consuming PIDs.
- Check user CPU.
- Check system CPU.
- Check idle CPU.
- Check I/O wait.
- Check runnable process count.
- Use mpstat for per-CPU behavior when available.
- Inspect threads for heavily threaded applications.
- Do not kill a process only because it is using CPU.

High load
- Determine whether CPUs are actually saturated.
- Check vmstat r.
- Check vmstat b.
- Check CPU idle percentage.
- Check I/O wait.
- Check storage latency.
- Check memory pressure.
- Check blocked processes.
- Remember that high load does not automatically mean CPU saturation.

Memory
- Run free -h.
- Inspect total memory.
- Inspect available memory.
- Inspect swap usage.
- Do not treat a low free column alone as failure.
- Sort processes by RSS.
- Record top memory consumers.
- Compare memory consumption with normal baseline.
- Check whether one process is growing continuously.
- Check shared-memory or tmpfs usage if relevant.

Swap
- Run swapon --show.
- Check vmstat si.
- Check vmstat so.
- Distinguish historical swap occupancy from active swap churn.
- Correlate swapping with application latency.
- Check whether swap capacity itself is exhausted.
- Avoid disabling swap during an incident without understanding the impact.

OOM
- Search kernel logs for OOM messages.
- Search for killed processes.
- Record which PID was killed.
- Record which service owned that PID.
- Check memory usage preceding the event.
- Check container or cgroup limits where relevant.
- Determine whether the problem is host-wide or service-specific.
- Investigate memory growth rather than merely restarting repeatedly.

Processes
- Record PID and parent PID.
- Record process user.
- Record process state.
- Record CPU percentage.
- Record RSS.
- Record elapsed runtime.
- Record command line.
- Check unexpected duplicate processes.
- Check restart loops.
- Check zombie processes.
- Inspect process threads where relevant.
- Inspect open files when necessary.
- Inspect sockets associated with the process.

Network interfaces
- Run ip -br addr.
- Confirm expected interfaces are up.
- Confirm expected addresses exist.
- Check IPv4 and IPv6 separately where relevant.
- Look for recently changed addresses.
- Check interface counters when packet loss is suspected.

Routing
- Run ip route.
- Confirm the default route.
- Check route to the specific destination with ip route get.
- Confirm expected source address.
- Confirm expected interface.
- Check policy routing when used.
- Check VPN or tunnel routes when relevant.

Listening sockets
- Run ss -lntp.
- Check the expected TCP port.
- Run ss -lnup for UDP services.
- Confirm the correct process owns the socket.
- Confirm the binding address.
- Distinguish localhost-only binding from external binding.
- Check IPv4 vs IPv6 listeners.
- Confirm application startup actually created the expected socket.

Connections
- Run ss -s for a summary.
- Inspect established connections when needed.
- Inspect unusual TCP-state accumulation.
- Check whether connection counts changed sharply.
- Check backend connection pools.
- Check proxy-to-application connections.
- Check application-to-database connections.

Local service test
- Test the service through localhost.
- Use the real health endpoint where available.
- Test the actual application port.
- Record response code.
- Record latency.
- Compare localhost behavior with remote behavior.
- If localhost works, investigate the network path outward.

DNS
- Test hostname resolution with getent hosts.
- Check resolvectl status on systems using systemd-resolved.
- Verify expected DNS servers.
- Compare hostname tests with direct-IP tests.
- Check whether failures affect one domain or all domains.
- Do not assume ping failure proves DNS failure.

Remote connectivity
- Test the required destination IP.
- Test the required TCP or UDP port.
- Use nc when available for basic TCP checks.
- Prefer protocol-level checks where practical.
- Verify TLS negotiation where HTTPS is involved.
- Verify proxy behavior.
- Verify load balancer health.
- Verify the upstream service itself is healthy.

Firewall
- Inspect relevant host firewall rules.
- Check cloud or provider security rules where applicable.
- Check container-network rules.
- Check reverse-proxy access rules.
- Do not broadly disable security controls merely to test connectivity.
- Make narrow, reversible test changes when required.

systemd
- Run systemctl --failed.
- Inspect systemctl status for the affected service.
- Record the main PID.
- Check restart count.
- Check exit codes.
- Check dependency failures.
- Check whether the unit was manually stopped.
- Check whether configuration reloads occurred.

Logs
- Use journalctl with a narrow time range.
- Filter by affected service.
- Inspect kernel logs.
- Inspect warnings and errors.
- Align timestamps with deployment events.
- Align timestamps with monitoring alerts.
- Align timestamps with resource spikes.
- Preserve relevant logs before rotation or cleanup.
- Avoid searching only for the word "error"; warnings and preceding events may matter.

Correlate evidence
- Build a timeline.
- Connect resource changes with process changes.
- Connect process changes with deployments.
- Connect application errors with dependency failures.
- Connect OOM events with memory growth.
- Connect high load with CPU or blocked I/O.
- Connect full filesystems with specific directories or files.
- Connect network failures with the exact layer that fails.

Safe remediation
- Form one specific hypothesis.
- Choose one corrective action.
- Predict what metric should change.
- Make the smallest reasonable change.
- Record the exact command or configuration change.
- Measure the system again.
- Confirm the user-visible symptom changed.
- Revert ineffective changes when practical.
- Avoid making several unrelated changes simultaneously.

Restarts
- Capture evidence before restarting when possible.
- Determine whether restart is safe.
- Understand dependent services.
- Check graceful shutdown behavior.
- Monitor startup logs.
- Verify ports reopen.
- Verify health checks.
- Verify resource usage after restart.
- Record whether the symptom returns.

Disk cleanup
- Identify files before removing them.
- Preserve incident evidence.
- Prefer application-supported log rotation.
- Check deleted open files.
- Avoid rm -rf against broad directories.
- Verify recovered space with df.
- Investigate why disk usage grew.
- Add monitoring or retention controls afterward.

Post-incident
- Record root cause if known.
- Separate root cause from contributing factors.
- Record recovery actions.
- Record timestamps.
- Record commands that produced useful evidence.
- Identify missing monitoring.
- Add disk-capacity alerts.
- Add inode alerts where relevant.
- Add memory and OOM monitoring.
- Add service availability checks.
- Add network dependency monitoring.
- Review log retention.
- Review capacity planning.
- Document the validated troubleshooting path.
12. FAQ
What should I check first when a Linux server is slow?
Establish the incident timeline and scope first. Then inspect uptime and load, failed services, filesystem capacity and inodes, CPU and process state, memory and swap, recent system logs, and network state. The combination usually tells you which subsystem deserves deeper analysis.
Why is load average high when CPU usage is not?
Linux load is not identical to CPU utilization. Tasks waiting in certain
uninterruptible states, commonly associated with I/O, can contribute to
load. Check vmstat runnable and blocked processes, CPU idle
time, I/O wait, and storage metrics before concluding that additional CPU
capacity is required.
Why can Linux report no space left when df shows free GB?
The filesystem may have exhausted its inodes. Run df -ih.
Quotas, read-only filesystem state, reserved space, or another filesystem
mounted below the path can also affect writes, so confirm the exact mount
containing the failing path.
Does low free RAM mean the system has a memory problem?
Not by itself. Linux uses RAM for caches that can often be reclaimed.
Inspect available memory, process RSS, active swap-in and
swap-out activity, application latency, and OOM events before diagnosing
memory exhaustion.
What should I use instead of netstat?
ss is the standard modern tool on many Linux systems for
inspecting listening sockets, active connections, TCP states, and socket
statistics.
Should I restart a service when it becomes slow?
A restart may be necessary for recovery, but first capture enough evidence to understand the state if operational conditions permit. Record resource usage, process state, sockets, and logs so a temporary restart does not erase the only useful clues.
Key terms (quick glossary)
- Load average
- A Linux system-load measurement reported over recent time intervals, reflecting runnable tasks and tasks in certain uninterruptible wait states.
- Inode
- A filesystem data structure representing a file or directory. A filesystem can exhaust available inodes even when storage blocks remain.
- RSS
- Resident Set Size, a measure of memory pages associated with a process that are currently resident in physical memory.
- Swap
- Disk-backed storage used by the kernel for memory pages that do not currently remain in physical RAM.
- OOM killer
- Kernel behavior that can terminate processes when the system or a constrained memory domain cannot satisfy memory demands.
- I/O wait
- CPU accounting associated with periods where CPUs are idle while the system has outstanding I/O activity.
- vmstat
- A Linux diagnostic utility reporting process, memory, paging, block I/O, and CPU statistics.
- df
- A utility that reports filesystem space usage and, with inode options, filesystem inode consumption.
- du
- A utility that estimates filesystem space consumed by files and directories visible through the directory tree.
- ss
- A Linux socket-inspection utility used to examine listeners, connections, TCP states, and socket statistics.
- journalctl
- The command-line interface used to inspect log entries stored by the systemd journal.
- systemctl
- The primary command used to inspect and control systemd units and services.
- Listening socket
- A network socket waiting for incoming connections on a local address and port.
- DNS resolution
- The process of translating a hostname into an address or other DNS record required to reach a service.
Worth reading
Recommended guides from the category.