Centralized logging often begins after the first frustrating production incident.
The application fails on one server, a background worker behaves differently on another, the reverse proxy reports a 502, and the engineer investigating the problem opens several SSH sessions just to reconstruct what happened.
Centralization fixes that problem, but it can introduce another one: collecting millions of lines that nobody can search efficiently and retaining them indefinitely simply because storage exists.
A useful small-stack logging system should make a specific production event easier to answer:
What happened?
When did it happen?
Which service produced it?
Which request or job was involved?
What failed immediately before it?
Which deployment was running?
Did the same failure happen elsewhere?
Logs are evidence, not a data landfill
Collect events that improve debugging, operational decisions, security review, or required auditability. A log line with no realistic future question attached to it is a candidate for removal, sampling, or a lower retention tier.
1. Start with the questions your logs must answer
Before selecting a collector or storage engine, write down the incidents you expect to investigate.
Application failure
You should be able to answer:
- Which service failed?
- Which endpoint or operation failed?
- What exception occurred?
- Which request triggered it?
- Which dependency was involved?
Slow request
You may need:
- Request ID.
- Normalized route.
- Duration.
- Database or upstream context.
- Trace ID if distributed tracing exists.
Background job failure
Record:
- Job type.
- Job ID when safe.
- Attempt number.
- Start and completion events.
- Failure category.
- Retry decision.
Security-relevant event
You may need to understand:
- Authentication success or failure.
- Privilege or role change.
- Administrative action.
- Configuration change.
- Source context appropriate to the environment.
Do not collect sensitive values merely because a security event occurred. Record useful metadata without logging credentials or session material.
2. Build a small centralized logging architecture
Centralized logging small-stack architecture (diagram)
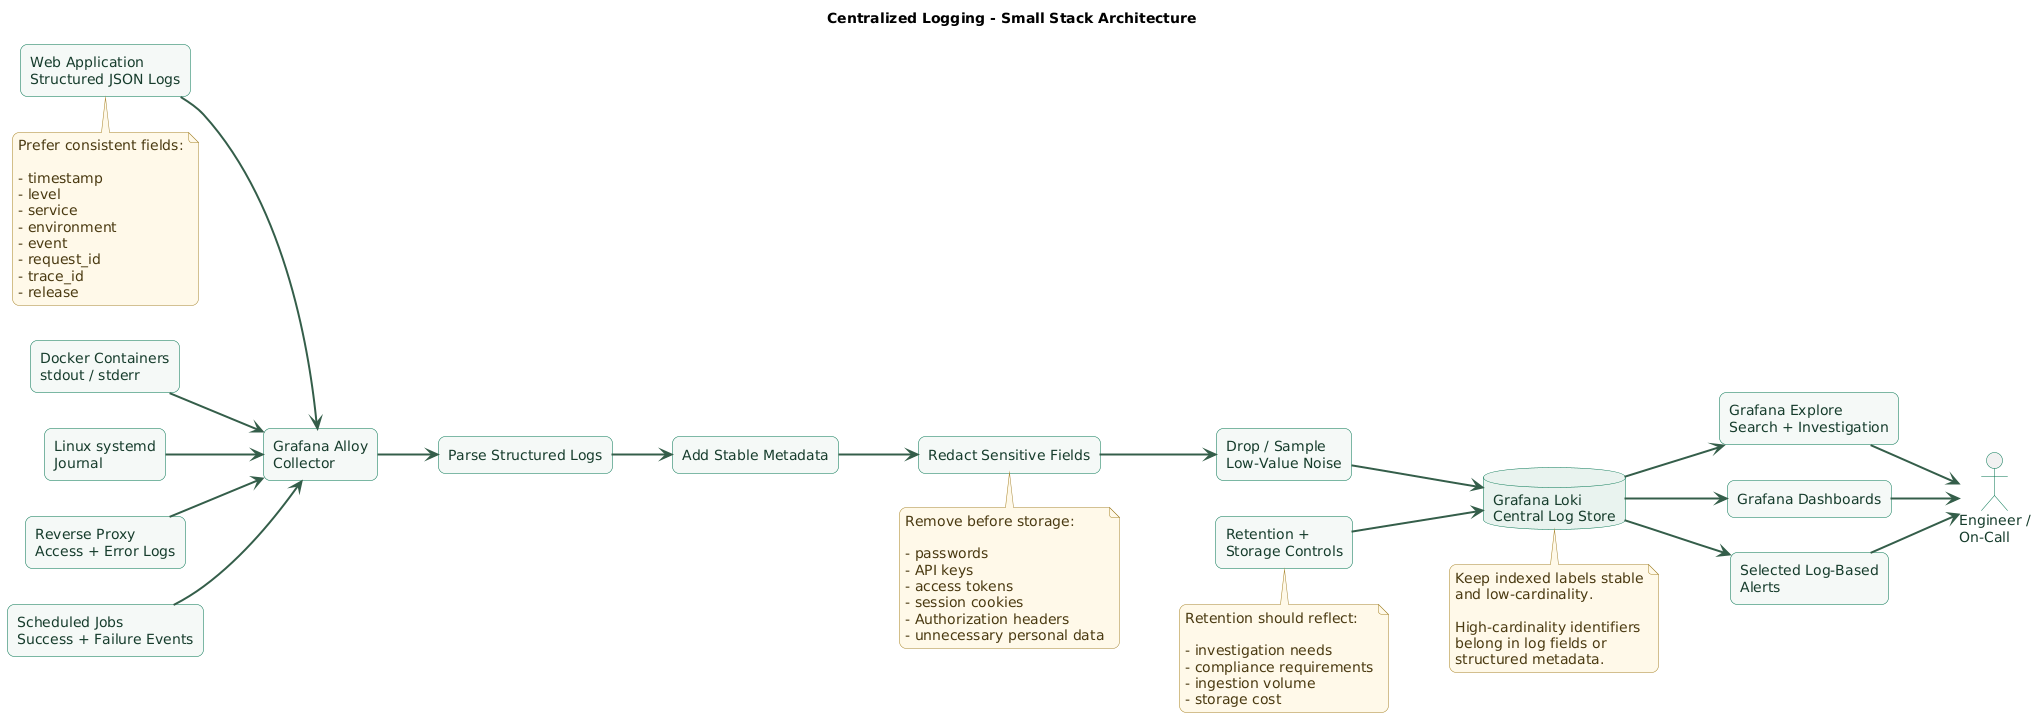
A small self-hosted Grafana-oriented stack can look like:
application stdout ──────┐
container logs ──────────┤
systemd journal ─────────┤
reverse proxy logs ──────┼──> Grafana Alloy
scheduled jobs ──────────┘        │
                                  │
                         parse / redact / label
                                  │
                                  ▼
                                Loki
                                  │
                    ┌─────────────┴─────────────┐
                    ▼                           ▼
              Grafana Explore             dashboards /
                  search                  selected alerts
Why use a collector?
Applications should not need custom code for communicating directly with your logging database.
A local collector can:
- Discover files or journal streams.
- Read container logs.
- Parse JSON or other formats.
- Add stable infrastructure context.
- Drop unwanted events.
- Redact selected fields.
- Forward logs to central storage.
Use a supported collection path
For a new Grafana Loki deployment in 2026, Grafana Alloy is the natural small-stack collector in the Grafana ecosystem.
Existing Promtail installations should be migrated rather than used as the foundation for a new deployment.
Keep local logging useful during central failure
Centralization should not make the application unable to operate when the log backend is temporarily unavailable.
The application should normally write locally through stdout, stderr, journald, or another appropriate mechanism while the collector handles shipping and buffering behavior.
3. Decide what logs are worth collecting
Application logs
These are usually the most valuable source because the application understands business context that the operating system does not.
Useful events include:
- Application startup and shutdown.
- Unexpected exceptions.
- Failed dependency calls.
- Important request failures.
- Queue processing failures.
- Important state transitions.
- Configuration validation failures.
Reverse proxy logs
Nginx, Caddy, HAProxy, or another edge proxy provides a useful independent view of:
- HTTP method.
- Request route or path.
- Status code.
- Response size.
- Request duration.
- Upstream status.
Be deliberate about query strings because they can contain secrets, personal data, tracking tokens, or unbounded identifiers.
Container logs
Containerized services should generally emit normal operational logs to stdout and errors to stderr rather than maintaining unmanaged application log files inside an ephemeral container filesystem.
Ensure the container runtime also has sensible local rotation or storage controls. Central shipping does not remove the risk of local log files consuming the host filesystem.
System logs
For Linux systems using systemd, selected journal entries can help explain:
- Service crashes.
- Restart loops.
- OOM events.
- Storage errors.
- Network-interface changes.
- Authentication events.
You do not necessarily need every journal entry from every unit.
Scheduled jobs
Backups, imports, report generation, certificate tasks, and synchronization jobs should leave clear start, success, and failure events.
{
  "level": "info",
  "event": "backup_completed",
  "service": "backup-worker",
  "duration_ms": 38421,
  "files": 18234,
  "destination": "primary-backup"
}
Do not centralize noise by default
Question sources such as:
- Verbose package-manager output.
- Health-check success on every request.
- Repeated debug loops.
- Static asset access logs.
- Normal polling traffic.
They may be useful temporarily, but permanent high-volume ingestion needs a reason.
4. Prefer structured application logs
Anatomy of a useful structured log event (diagram)

Compare an unstructured message:
Payment failed for customer while calling providerwith a structured event:
{
  "timestamp": "2026-08-23T14:42:18.219Z",
  "level": "error",
  "service": "checkout-api",
  "environment": "production",
  "event": "payment_provider_failed",
  "message": "Payment provider request failed",
  "request_id": "req_01J...",
  "trace_id": "4bf92f3577b34da6...",
  "route": "/checkout",
  "method": "POST",
  "provider": "primary",
  "duration_ms": 1834,
  "error_type": "ProviderTimeout",
  "release": "8f21c36"
}
The second event is easier to filter, aggregate, correlate, and present.
Useful baseline fields
Consider standardizing:
timestamp
level
service
environment
event
message
release
Request-oriented services can add:
request_id
trace_id
method
route
status_code
duration_ms
Use normalized routes
Prefer:
/users/:id/orders/:orderIdover creating a category from:
/users/219381/orders/981337
/users/781132/orders/129334
/users/993821/orders/774193
The normalized route remains useful without creating unlimited values in dashboards or indexed dimensions.
Use machine-readable timestamps
Emit precise timestamps with timezone context, commonly UTC:
2026-08-23T14:42:18.219ZAvoid timestamps whose timezone can only be guessed later.
Keep message and event separate
"event": "user_login_failed",
"message": "Authentication failed"
The stable event name is useful for machines and searches. The message is useful for humans.
5. Add request and trace correlation
A centralized log system becomes much more useful when one user request can be followed through several services.
Request ID
Generate or accept an identifier at the request boundary and propagate it through the request path.
reverse proxy
    request_id=req-123
        ↓
web API
    request_id=req-123
        ↓
payment service
    request_id=req-123
Searching for one identifier can then reconstruct the event sequence.
Trace ID
If distributed tracing is available, include the current trace ID in log records associated with request processing.
OpenTelemetry log records support trace and span context, allowing logs and traces to be connected without inventing a different correlation model.
Do not turn correlation IDs into high-cardinality index labels
A request ID changes for every request. A trace ID changes for every trace.
They are extremely useful search values but generally poor Loki stream labels.
Keep them as:
- JSON fields in the log line.
- Structured metadata where appropriate.
- Trace context supported by your telemetry pipeline.
Propagate correlation consistently
A request ID existing in only half of your services creates a broken investigation path.
Document:
incoming request
    ↓
accept existing trusted correlation header
or generate request ID
    ↓
store in request context
    ↓
add automatically to logs
    ↓
forward to downstream calls
6. Use log levels consistently
Teams often produce noisy logging because developers disagree about what each level means.
ERROR
An operation failed and the event is important enough for investigation.
Examples:
- Unexpected exception.
- Required dependency call failed.
- Database transaction failed.
- Job permanently failed.
WARN
Something abnormal happened, but the current operation may still succeed or recover.
Examples:
- Dependency retry.
- Deprecated configuration detected.
- Approaching internal limit.
- Fallback behavior activated.
INFO
Important normal lifecycle or business events.
Examples:
- Service started.
- Deployment version loaded.
- Scheduled job completed.
- Important state transition completed.
DEBUG
Detailed diagnostic information that is useful during investigation but often too verbose for permanent production ingestion.
Consider enabling it temporarily for one service or environment rather than collecting full debug output continuously.
Avoid duplicate error logging
A common pattern is:
database layer logs error
    ↓
service layer logs same error
    ↓
HTTP layer logs same error
    ↓
proxy logs resulting 500
Some duplication is natural across system boundaries, but logging the same exception three times inside one process creates noise.
Prefer one detailed event at the layer that has enough context to describe the failure.
7. Keep Loki labels low-cardinality
Loki organizes logs into streams identified by their label sets.
Every different combination of indexed label values creates another stream, so label selection directly affects storage and query behavior.
Good labels describe stable sources
environment="production"
service="checkout-api"
region="eu-west"
host="web-02"
These values are bounded and useful for narrowing most searches.
Bad labels have many unique values
request_id
trace_id
user_id
session_id
order_id
ip_address
timestamp
Turning such fields into indexed labels can create huge numbers of log streams.
Start with fewer labels
For a very small server stack, this may be enough:
environment
service
host
Add another label only when it significantly improves frequent queries and its value set remains controlled.
Keep searchable details inside structured logs
A JSON event can retain:
request_id
trace_id
route
status_code
error_type
deployment
duration_ms
without requiring all of those fields to become indexed stream labels.
Query by stable labels first
Conceptually:
{environment="production", service="checkout-api"}
| json
| level="error"
Then narrow further:
{environment="production", service="checkout-api"}
| json
| request_id="req_01J..."
Also narrow the time interval aggressively during incident investigation.
8. Control volume, retention, and storage cost
Logging cost is roughly driven by how much you ingest, how long you keep it, and how expensive your queries are.
Do not retain everything forever
Choose retention based on actual requirements.
For example:
high-volume operational logs:
14-30 days

important production errors:
30-90 days

audit/security events:
policy-defined retention
These are examples, not universal requirements. Legal, contractual, and security obligations may require different retention.
Measure daily ingestion
A sudden increase from:
2 GB/day
to
25 GB/day
often means a new debug statement, retry loop, stack trace flood, or unexpectedly verbose dependency.
Filter before storage when safe
Examples of candidates for dropping or sampling include:
- Successful health-check requests.
- Static asset access logs.
- Routine polling.
- Known harmless repetitive debug messages.
Filtering should be configuration-controlled and documented so important evidence does not disappear silently.
Fix loops instead of accepting their volume
A service producing 500 identical errors per second is not primarily a storage problem.
Rate-limit repeated messages where appropriate and fix the failure behavior creating them.
Keep local retention bounded too
If Docker stores local container logs, configure an appropriate logging driver and rotation policy.
Central logging does not help when an unbounded local container logfile fills the production host before the central copy expires.
9. Keep secrets and unnecessary personal data out
Centralizing logs creates a powerful searchable dataset. That also makes mistakes easier to distribute.
Never intentionally log credentials
Exclude:
passwords
API keys
access tokens
refresh tokens
session cookies
Authorization headers
private keys
database credentials
Be careful with request bodies
Logging complete HTTP request bodies can capture:
- Passwords.
- Payment information.
- Addresses.
- Health or personal information.
- Uploaded documents.
Log specific safe fields instead of serializing complete incoming requests.
Redact at the application when possible
The safest secret is one that never enters the log pipeline.
{
  "event": "external_api_failed",
  "provider": "example",
  "status": 401,
  "authorization": "[REDACTED]"
}
Collector-side redaction is a useful additional defense, but it should not be the only reason application developers feel safe logging arbitrary objects.
Restrict log access
Central logs may reveal internal architecture, usernames, IP addresses, business operations, stack traces, and identifiers.
Apply:
- Authentication.
- Least-privilege access.
- TLS where appropriate.
- Protected collector credentials.
- Controlled retention.
Define a log data policy
Developers should know which fields are:
allowed
restricted
redacted
prohibited
That is more reliable than discovering sensitive logging through an incident.
10. Make logs searchable during incidents
Central logging is valuable only if responders can find the relevant evidence quickly.
Start with service and time
If an alert fired at 14:42, do not begin with a seven-day search across every service.
Begin with:
environment = production
service = checkout-api
time = 14:35 to 14:50
Then narrow by severity or event
{environment="production", service="checkout-api"}
| json
| level="error"
Search one request
{environment="production"}
|= "req_01J..."
This is where consistent correlation identifiers become especially valuable.
Search around deployments
Include a release or version field:
"release": "8f21c36"Then an incident investigation can compare errors before and after a deployment.
Create saved operational queries
Useful examples:
- Production errors by service.
- Failed background jobs.
- Authentication failures.
- Reverse proxy 5xx responses.
- Service restart events.
- Database timeout errors.
Responders should not need to remember complex query syntax while an outage is active.
11. Use log-based alerts selectively
Logging retention and alerting workflow (diagram)
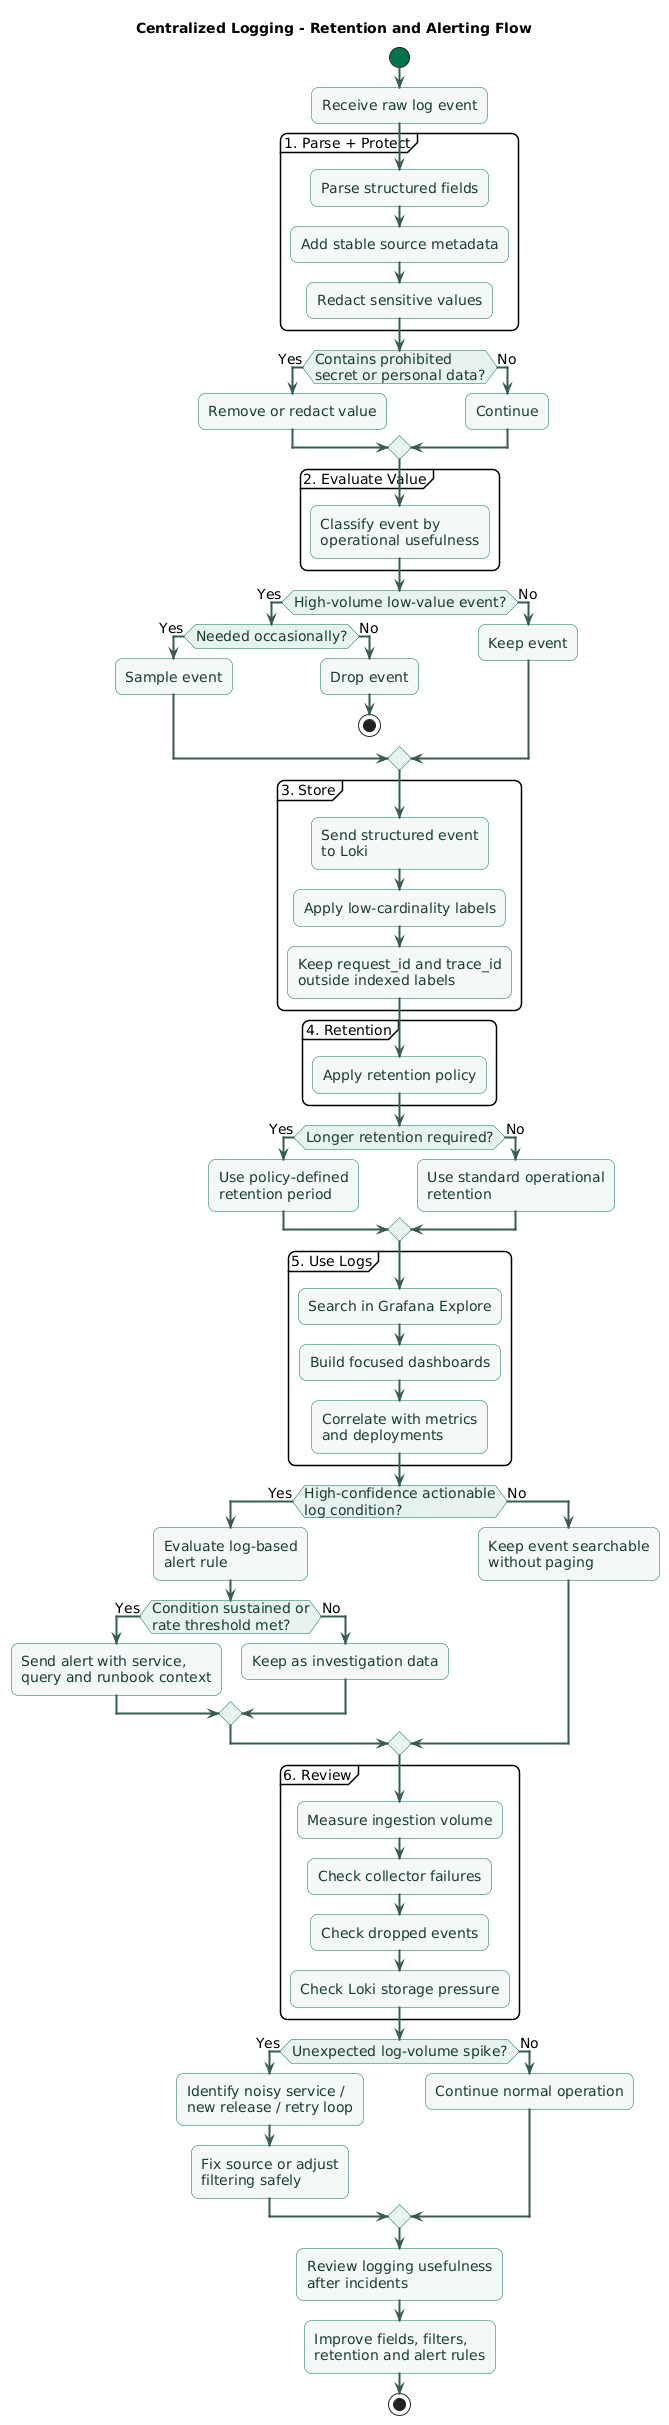
Metrics are usually the better first tool for continuous service health and alerting.
Logs are detailed and irregular. An individual error line may be harmless while a missing log line may be difficult to interpret.
Good log-based alert candidates
- A known fatal startup failure.
- A scheduled job emits a permanent-failure event.
- A security-sensitive administrative event occurs unexpectedly.
- A specific error signature occurs repeatedly above a meaningful rate.
Avoid paging on every ERROR line
Applications frequently log recoverable errors, client failures, and expected exceptions.
A rule such as:
any ERROR
    ↓
wake on-call
usually becomes noisy quickly.
Connect log alerts to context
A useful notification should include:
- Service.
- Environment.
- Error event.
- Time window.
- Relevant log query.
- Dashboard or runbook.
Monitor the pipeline itself
Your logging stack can fail while applications continue running.
Monitor:
- Collector availability.
- Delivery failures.
- Dropped events.
- Loki ingestion errors.
- Storage capacity.
- Unexpected ingestion-rate changes.
“No errors in centralized logs” means little if the collector stopped sending logs twenty minutes ago.
Logs complement metrics
Let metrics detect broad service degradation and use logs to explain the detailed sequence of events. Log-derived alerts are valuable when the event itself is authoritative, but they should not turn the logging system into a noisy replacement for service monitoring.
12. Copy/paste centralized logging checklist
Centralized logging checklist

Goals
- List the incidents logs should help investigate.
- Identify critical application services.
- Identify important background jobs.
- Identify important infrastructure sources.
- Identify security-relevant events.
- Define who uses the logs.
- Define typical investigation time ranges.
- Do not collect data without an operational or policy reason.

Architecture
- Choose one central log store.
- Choose a supported collector.
- Keep collection configuration in source control.
- Separate application logging from log transport.
- Keep applications functional if central logging is temporarily unavailable.
- Protect collector credentials.
- Protect the central log endpoint.
- Document the data path from source to storage.

Collector
- Deploy a collector near log sources.
- Collect container output where needed.
- Collect selected systemd journal sources.
- Collect reverse proxy logs.
- Collect application file logs only when stdout or journal collection is unsuitable.
- Parse structured formats.
- Add stable source metadata.
- Drop known low-value events where appropriate.
- Redact prohibited values.
- Monitor collector health.
- Monitor collector delivery failures.

Grafana ecosystem
- Use Grafana Alloy for new Loki collection deployments.
- Do not start new deployments around unsupported Promtail.
- Send logs to Loki.
- Use Grafana Explore for investigation.
- Create a small number of operational dashboards.
- Keep Loki configuration and retention documented.

Application logging
- Prefer structured JSON.
- Emit one event per log record.
- Include timestamp.
- Include severity.
- Include service.
- Include environment.
- Include stable event name.
- Include human-readable message.
- Include release or deployment version.
- Include useful safe context.
- Avoid dumping arbitrary application objects.

Timestamps
- Use machine-readable timestamps.
- Include timezone information.
- Prefer UTC for central systems.
- Keep host clocks synchronized.
- Preserve source event time.
- Distinguish source time from collector observation time when needed.
- Investigate large clock drift.

HTTP request logging
- Include request ID.
- Include HTTP method.
- Include normalized route.
- Include status code.
- Include duration.
- Include relevant upstream result.
- Avoid raw query strings when they may contain sensitive values.
- Avoid full request bodies.
- Avoid full response bodies.
- Do not log Authorization headers.
- Do not log session cookies.

Correlation
- Generate or propagate request IDs.
- Add request IDs automatically to application logs.
- Forward correlation IDs to downstream services.
- Include trace IDs when tracing is available.
- Include span context where appropriate.
- Use consistent field names across services.
- Test that one request can be followed across service boundaries.
- Do not make request ID an indexed Loki label.
- Do not make trace ID an indexed Loki label.

Exceptions
- Record exception type.
- Record useful error message.
- Record stack trace for unexpected failures where appropriate.
- Add request or job context.
- Avoid logging the same exception repeatedly at every layer.
- Preserve root cause where possible.
- Do not expose secrets inside exception context.

Log levels
- Define ERROR semantics.
- Define WARN semantics.
- Define INFO semantics.
- Define DEBUG semantics.
- Use levels consistently across services.
- Avoid calling normal client behavior ERROR when it is expected.
- Keep production DEBUG disabled by default where volume is high.
- Support targeted temporary debugging where practical.
- Review noisy loggers regularly.

Business events
- Log important state transitions.
- Log critical job completion.
- Log critical job failure.
- Log important administrative actions.
- Use stable event names.
- Avoid turning every database operation into a business event.
- Keep business-event definitions documented.

Containers
- Write normal application logs to stdout and stderr.
- Avoid unmanaged log files inside ephemeral containers.
- Check the Docker logging driver.
- Configure local log rotation or bounded storage.
- Remember centralized shipping does not prevent local disk exhaustion.
- Verify container recreation preserves collection behavior.
- Avoid logging secrets through container environment dumps.

Linux and systemd
- Collect service crash events.
- Collect useful systemd unit events.
- Collect OOM events where operationally relevant.
- Collect selected authentication events if required.
- Avoid shipping every journal event without evaluating value.
- Keep host and unit metadata available.
- Preserve enough local journal history for emergency fallback.

Reverse proxy
- Collect request status.
- Collect response duration.
- Collect upstream status.
- Collect normalized or safe path context.
- Include request correlation IDs where possible.
- Avoid sensitive query strings.
- Avoid unnecessary headers.
- Consider excluding high-volume static asset success logs.
- Retain proxy error logs.

Labels
- Keep indexed labels low-cardinality.
- Use environment as a label where useful.
- Use service as a label.
- Use stable region or cluster labels where appropriate.
- Use host labels only when operationally useful.
- Add labels only for frequently used query dimensions.
- Avoid request IDs as labels.
- Avoid trace IDs as labels.
- Avoid user IDs as labels.
- Avoid order IDs as labels.
- Avoid session IDs as labels.
- Avoid timestamps as labels.
- Review label cardinality periodically.

Structured metadata
- Use structured metadata for useful high-cardinality context where supported.
- Keep request IDs searchable.
- Keep trace IDs searchable.
- Keep selected identifiers searchable only when operationally justified.
- Avoid duplicating every field into both labels and metadata.
- Document which fields are indexed and which are not.

Queries
- Narrow the time range first.
- Select environment.
- Select service.
- Parse structured fields.
- Filter by event or severity.
- Search correlation IDs when investigating one request.
- Save common incident queries.
- Link useful queries from runbooks.
- Avoid expensive broad regex searches when simpler filters work.
- Test common queries before an incident.

Dashboards
- Show error events over time where useful.
- Show important job failures.
- Show top error categories.
- Show log ingestion volume.
- Show collector failures.
- Link dashboards to metrics dashboards.
- Add deployment context where possible.
- Do not create dashboards for every possible log field.

Retention
- Define default retention.
- Define any required longer-retention categories.
- Base retention on actual investigation needs.
- Account for legal and contractual requirements.
- Avoid indefinite retention by default.
- Measure daily ingestion volume.
- Estimate storage growth.
- Monitor Loki storage capacity.
- Review retention as traffic grows.
- Delete expired data according to policy.

Volume control
- Measure logs per service.
- Detect sudden ingestion spikes.
- Drop unnecessary health-check successes.
- Consider removing static asset access logs.
- Reduce repetitive polling logs.
- Rate-limit repeated identical application errors where appropriate.
- Avoid permanent DEBUG logging.
- Sample very high-volume low-value events when justified.
- Fix runaway log loops.
- Keep filtering rules version-controlled.

Sensitive information
- Never log passwords.
- Never log API keys.
- Never log access tokens.
- Never log refresh tokens.
- Never log private keys.
- Never log database passwords.
- Never log session cookies.
- Never log Authorization headers.
- Avoid full request bodies.
- Avoid full response bodies.
- Minimize personal information.
- Redact sensitive values before collection.
- Treat collector-side redaction as defense in depth.

Access control
- Require authentication for Grafana and Loki access.
- Apply least privilege.
- Restrict administrative log access.
- Protect API credentials.
- Use encrypted transport where appropriate.
- Review user access periodically.
- Remove access when responsibilities change.
- Treat centralized logs as potentially sensitive production data.

Log alerts
- Prefer metrics for broad service-health alerts.
- Use log alerts for authoritative event patterns.
- Do not page on every ERROR line.
- Add rate or duration conditions where appropriate.
- Include service and environment.
- Include a useful log query.
- Include dashboard link.
- Include runbook link.
- Route alerts to an owner.
- Review noisy log alerts after incidents.

Pipeline monitoring
- Monitor Alloy availability.
- Monitor collection failures.
- Monitor dropped events.
- Monitor Loki ingestion errors.
- Monitor Loki storage.
- Monitor query failures.
- Monitor unexpected drops in log volume.
- Monitor unexpected spikes in log volume.
- Verify the logging pipeline after upgrades.
- Keep local troubleshooting access available for central failures.

Deployment context
- Include application release.
- Include build or commit identifier.
- Annotate deployments where possible.
- Compare errors before and after releases.
- Keep release identifiers consistent between logs and metrics.
- Link incidents to the exact deployed version.

Incident response
- Start with the affected time window.
- Filter by environment.
- Filter by service.
- Find the first relevant failure.
- Search the same request ID.
- Search the same trace ID.
- Check related upstream services.
- Compare with deployment time.
- Correlate logs with metrics.
- Preserve relevant evidence.
- Record useful queries in the incident timeline.

Review
- Identify logs that were essential during incidents.
- Identify missing context.
- Remove useless noisy events.
- Improve field consistency.
- Improve correlation propagation.
- Review retention.
- Review sensitive-data exposure.
- Review label cardinality.
- Review saved queries.
- Review log alerts.
- Update runbooks.

Final review
- Can you find all logs for one service quickly?
- Can you reconstruct one failed request?
- Can you identify the deployed version?
- Can you distinguish error categories without regex guesswork?
- Are timestamps consistent?
- Are labels low-cardinality?
- Are request and trace IDs searchable without becoming labels?
- Are secrets excluded?
- Is retention explicit?
- Is local log storage bounded?
- Can you tell when log collection itself is broken?
- Does the logging stack make incidents faster to understand?
13. FAQ
What logs should a small production stack centralize first?
Start with application errors and important lifecycle events, reverse proxy access and error information, significant background job outcomes, selected service and system events, and authentication or administrative events that have real operational or audit value.
Should request IDs and trace IDs be Loki labels?
Usually not. They have extremely high cardinality because almost every request or trace produces a new value. Keep them as structured log fields or structured metadata and search them when investigating a specific request.
Should applications log in JSON?
For centrally collected application logs, structured JSON is often a good choice because fields such as severity, service, event, request ID, route, duration, and exception type can be parsed reliably rather than extracted from free-form text.
Should Docker applications write logs to files?
Small containerized services generally benefit from sending operational logs to stdout and stderr and allowing the runtime and log collector to handle collection and local retention. Application-specific persistent files are appropriate only when there is a clear requirement.
How long should I retain logs?
There is no universal retention period. Base it on incident investigation needs, compliance obligations, security requirements, event volume, and storage cost. Make the decision explicit rather than retaining everything forever.
Can centralized logs replace Prometheus metrics?
No. Metrics are usually better for continuous service health, trends, capacity, and alerting. Logs provide detailed event evidence. During an incident, metrics often identify where and when a problem started while logs help explain why.
Key terms (quick glossary)
- Centralized logging
- A system that collects logs from multiple applications, hosts, or services into a shared storage and query platform.
- Structured logging
- Logging where events contain machine-readable named fields such as JSON keys rather than relying entirely on unstructured text.
- Grafana Alloy
- An observability collector in the Grafana ecosystem capable of collecting, processing, and forwarding logs, metrics, traces, and other telemetry.
- Grafana Loki
- A log aggregation system that organizes log streams using labels and supports querying through LogQL.
- LogQL
- The query language used with Grafana Loki to select log streams, filter entries, parse fields, and derive log-based metrics.
- Label
- An indexed key-value dimension used by Loki to identify and organize log streams.
- Cardinality
- The number of distinct combinations or values represented by indexed dimensions. Excessive cardinality can create too many log streams.
- Structured metadata
- Metadata associated with a Loki log entry without using that value to create an indexed log stream, useful for selected high-cardinality context.
- Request ID
- An identifier propagated through processing of one request so related events can be correlated across components.
- Trace ID
- An identifier representing a distributed trace and commonly propagated across participating services.
- Retention
- The period for which stored logs remain available before being removed according to storage and data policies.
- Redaction
- Removal or replacement of sensitive information before it becomes available in centralized logs.
- Log ingestion
- The process of receiving log records into a centralized logging backend.
- Correlation
- Connecting related telemetry such as application logs, proxy events, metrics, and traces using common identifiers, timestamps, services, or deployment metadata.
Worth reading
Recommended guides from the category.