
A classification model can have 99% accuracy and still be nearly useless. Another model can have an excellent ROC-AUC while producing far too many false alerts at the threshold you can actually deploy. A third can have a respectable F1 score while performing badly on the subgroup that matters most.
None of those metrics is inherently bad. The problem is asking one number to answer a question it was never designed to answer.
Metric selection should begin with the decision being made: what counts as a positive case, what happens after the model predicts positive, how costly false positives are, how costly false negatives are, and whether you need correct labels, useful rankings, or trustworthy probabilities.
Choose the error before choosing the metric
Ask whether a false positive or a false negative causes the greater operational harm. That question often tells you more than asking whether accuracy, F1, or ROC-AUC is the “best” metric.
1. Start with the confusion matrix
Accuracy, precision, recall, and F1 are all summaries of the same basic classification outcomes.
Classification metrics from the confusion matrix (diagram)
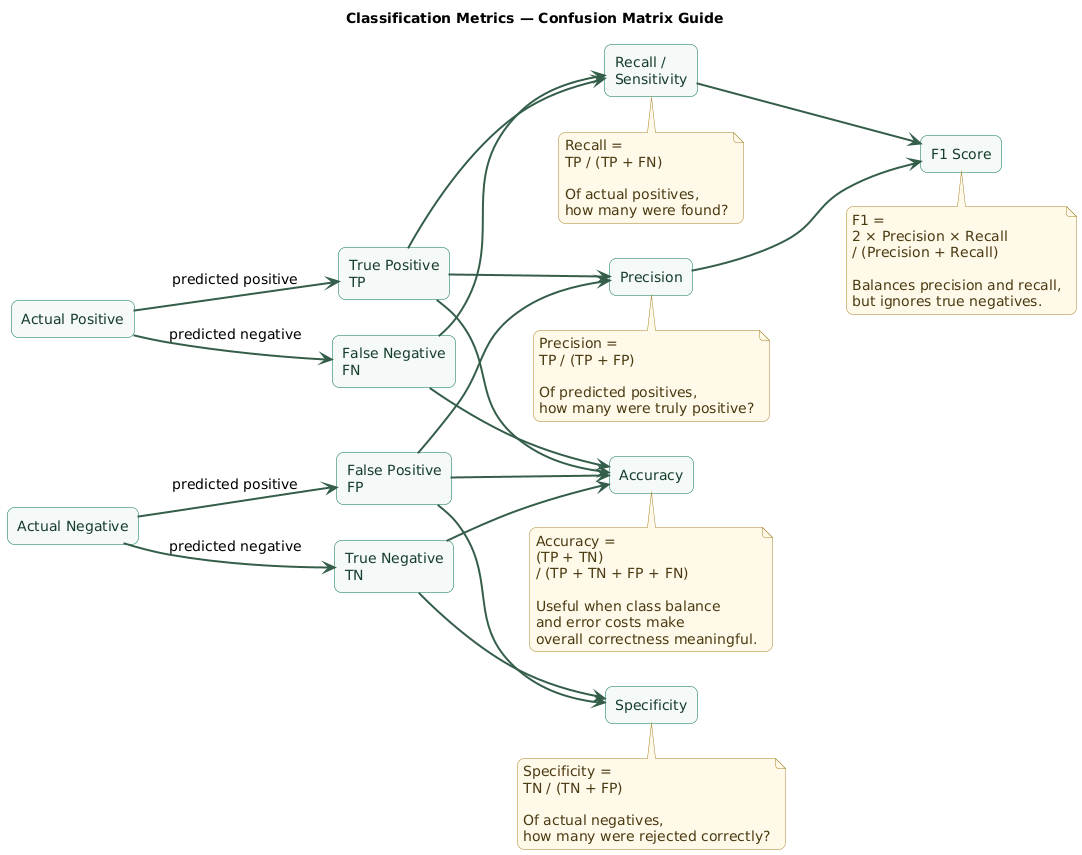
The four outcomes
- True positive (TP): positive case predicted positive.
- False positive (FP): negative case predicted positive.
- False negative (FN): positive case predicted negative.
- True negative (TN): negative case predicted negative.
Before reporting percentages, inspect the actual counts.
from sklearn.metrics import confusion_matrix

tn, fp, fn, tp = confusion_matrix(
    y_test,
    y_pred
).ravel()

print("TP:", tp)
print("FP:", fp)
print("FN:", fn)
print("TN:", tn)
A stakeholder may understand “340 false fraud alerts per day” much more clearly than “precision = 0.41.”
Do not lose the denominators
Two models can have the same percentage metric but dramatically different operational consequences if deployment volume differs.
Always connect rates back to expected counts:
expected_false_positives_per_day =
    false_positive_rate * daily_negative_cases
2. When accuracy tells the truth — and when it does not
Accuracy is the fraction of predictions that exactly match the true labels.
from sklearn.metrics import accuracy_score

accuracy = accuracy_score(
    y_test,
    y_pred
)

print(accuracy)
Accuracy is intuitive and useful when:
- Classes are reasonably balanced.
- False positives and false negatives have similar costs.
- Every observation has roughly similar importance.
- The decision threshold is already meaningful.
The 99% accuracy trap
Imagine 10,000 transactions:
9,900 legitimate
100 fraudulent
A classifier that predicts every transaction as legitimate gets:
9,900 / 10,000 = 99% accuracyYet it detects zero fraudulent transactions.
The metric is mathematically correct. The interpretation is wrong because the majority class dominates the denominator.
Compare against the trivial baseline
Before celebrating accuracy, calculate what happens if you always predict the most common class.
majority_accuracy = (
    y_test.value_counts(normalize=True).max()
)

print(majority_accuracy)
A model with 95% accuracy is not impressive when the majority-class baseline already achieves 96%.
Balanced accuracy
When class frequencies differ, balanced accuracy can provide another useful view by giving equal importance to recall across classes.
from sklearn.metrics import balanced_accuracy_score

score = balanced_accuracy_score(
    y_test,
    y_pred
)
High accuracy does not imply good minority-class performance
Always inspect class frequencies and the confusion matrix before interpreting accuracy on an imbalanced dataset.
3. Precision vs recall: which mistake costs more?
Precision
Precision asks:
Of the cases we predicted as positive, how many were actually positive?
precision = TP / (TP + FP)High precision means few false positives among positive predictions.
Precision matters when positive actions are expensive
Examples:
- A human investigator must review every alert.
- A user account may be blocked after a positive prediction.
- A sales team can contact only a limited number of leads.
- An expensive intervention follows each model alert.
Recall
Recall asks:
Of all truly positive cases, how many did we find?
recall = TP / (TP + FN)High recall means fewer positive cases are missed.
Recall matters when misses are expensive
Examples:
- Screening for a dangerous failure.
- Detecting suspicious transactions for further review.
- Finding cybersecurity incidents.
- Retrieving candidate documents where missing a relevant item is costly.
Calculate both
from sklearn.metrics import precision_score
from sklearn.metrics import recall_score

precision = precision_score(
    y_test,
    y_pred
)

recall = recall_score(
    y_test,
    y_pred
)

print("Precision:", precision)
print("Recall:", recall)
Precision and recall usually trade against each other as the classification threshold changes.
4. What F1 summarizes — and what it hides
F1 combines precision and recall using their harmonic mean.
F1 = 2 * precision * recall
     / (precision + recall)
The harmonic mean penalizes a model when one of the two values is much lower than the other.
from sklearn.metrics import f1_score

f1 = f1_score(
    y_test,
    y_pred
)

print(f1)
F1 is useful when
- The positive class is important.
- You want a single summary of precision and recall.
- Neither precision nor recall should collapse.
- True negatives are not a central part of the objective.
F1 ignores true negatives
That can be desirable, but it also means F1 cannot describe every classification problem.
If correctly rejecting millions of negative events is operationally important, a metric that ignores TN may not tell the whole story.
F1 assumes equal emphasis on precision and recall
A business may care much more about one type of error.
F-beta allows asymmetric emphasis:
- beta > 1: more weight on recall.
- beta < 1: more weight on precision.
- beta = 1: ordinary F1.
from sklearn.metrics import fbeta_score

f2 = fbeta_score(
    y_test,
    y_pred,
    beta=2
)
F1 depends on the threshold
The same model scores can produce very different F1 scores depending on where you convert scores into class labels.
Therefore, comparing F1 without documenting the threshold can hide an important part of the decision process.
5. What ROC-AUC actually measures
ROC analysis looks at the relationship between:
- True positive rate — recall.
- False positive rate.
as the decision threshold changes.
from sklearn.metrics import roc_auc_score

auc = roc_auc_score(
    y_test,
    y_probability
)

print(auc)
Think of ROC-AUC as discrimination or ranking quality
A useful interpretation is that a model with stronger ROC-AUC tends to assign higher scores to positive observations than to negative ones.
This is valuable when:
- You are comparing ranking models.
- The final threshold has not yet been chosen.
- You want performance summarized across many operating points.
- Both TPR and FPR matter.
What ROC-AUC does not tell you
A high ROC-AUC does not guarantee:
- Good precision at your deployment threshold.
- A manageable number of false alerts.
- Well-calibrated probabilities.
- High F1.
- Correct business decisions.
Why imbalance can make ROC-AUC feel optimistic
False positive rate divides false positives by the total number of actual negatives:
FPR = FP / (FP + TN)When negatives are extremely numerous, thousands of false positives can still correspond to a numerically small FPR.
That does not make ROC-AUC mathematically wrong. It means the metric may emphasize a different operational question from the one you care about.
ROC-AUC is not your deployment policy
A model can rank observations well and still require careful threshold selection before its predictions are operationally useful.
6. Precision-recall and Average Precision for rare positives
When positive cases are rare, inspect the precision-recall curve.
from sklearn.metrics import precision_recall_curve

precision, recall, thresholds = precision_recall_curve(
    y_test,
    y_probability
)
Instead of plotting recall against false-positive rate, this directly shows the tradeoff between:
- How many positives you find.
- How trustworthy your positive predictions are.
Average Precision
from sklearn.metrics import average_precision_score

ap = average_precision_score(
    y_test,
    y_probability
)

print("Average Precision:", ap)
Average Precision summarizes precision-recall performance across score thresholds.
Be precise in terminology: scikit-learn's
average_precision_score() is not simply the trapezoidal area
under the precision-recall curve.
Use precision-recall views when
- The positive class is rare.
- False positive volume matters strongly.
- You care about the quality of positive predictions.
- You need to understand the precision cost of increasing recall.
7. Your classification threshold is part of the product
Classification threshold tradeoffs (diagram)
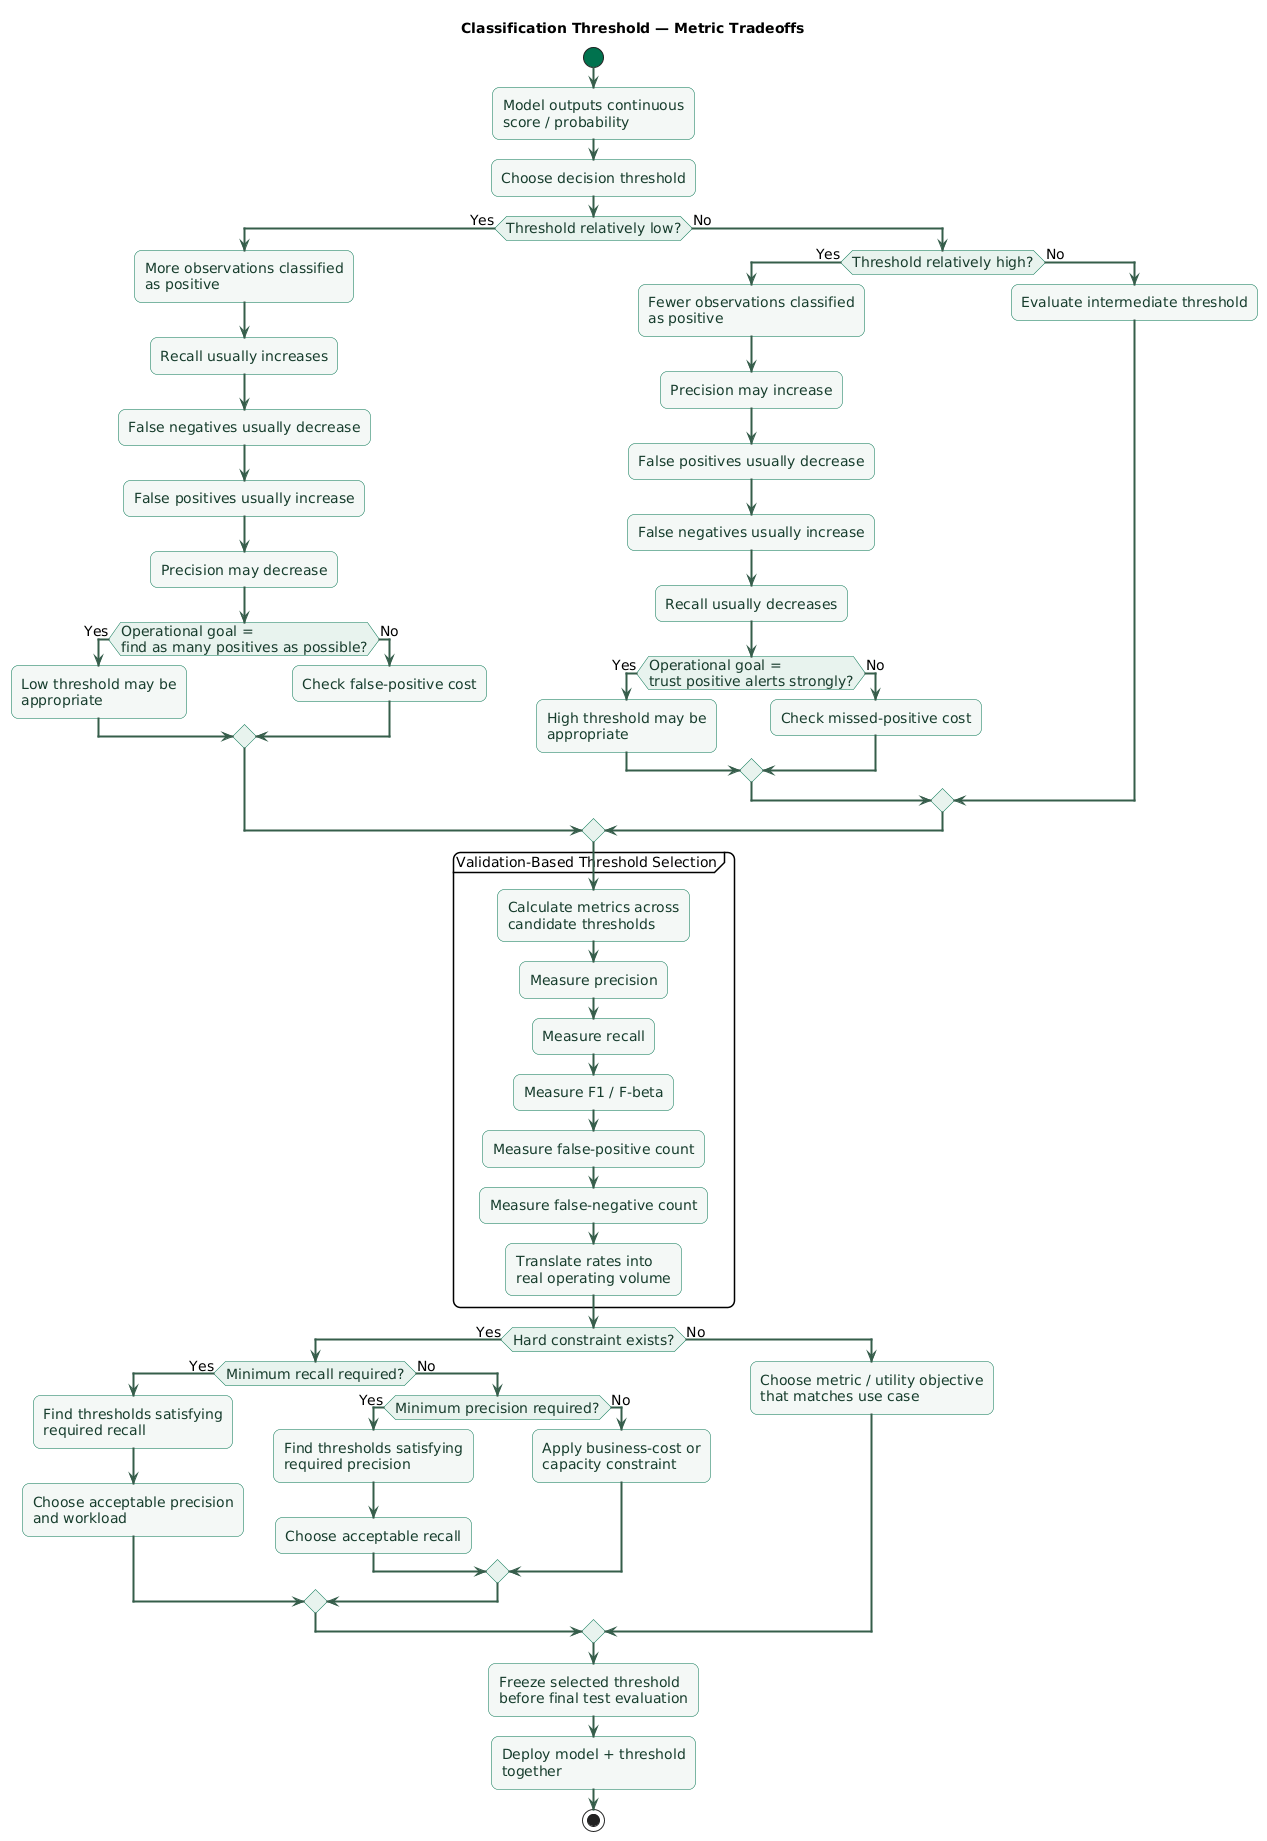
A classifier often produces a continuous score or estimated probability. The class prediction appears only after a threshold is applied.
y_probability = model.predict_proba(X_valid)[:, 1]

threshold = 0.35

y_pred = (
    y_probability >= threshold
).astype(int)
Lower threshold
Usually means:
- More positive predictions.
- Higher recall.
- More false positives.
- Potentially lower precision.
Higher threshold
Usually means:
- Fewer positive predictions.
- Potentially higher precision.
- More false negatives.
- Lower recall.
Search thresholds on validation data
import numpy as np

from sklearn.metrics import precision_score
from sklearn.metrics import recall_score
from sklearn.metrics import f1_score

scores = []

for threshold in np.arange(
    0.10,
    0.91,
    0.05
):
    prediction = (
        y_probability >= threshold
    ).astype(int)

    scores.append({
        "threshold": threshold,
        "precision": precision_score(
            y_valid,
            prediction,
            zero_division=0
        ),
        "recall": recall_score(
            y_valid,
            prediction,
            zero_division=0
        ),
        "f1": f1_score(
            y_valid,
            prediction,
            zero_division=0
        )
    })
Do not choose the threshold on the final test set
Once test results influence threshold selection, the test set becomes part of model development.
Choose the threshold through validation or cross-validation, freeze the decision, then evaluate once on the final held-out test set.
Optimize real constraints
The best threshold may not maximize F1.
You may instead require:
recall >= 0.95

precision >= 0.80

false_positives_per_day <= 100

manual_reviews_per_day <= 500
Those constraints can be far closer to the actual production problem.
8. Which metric should you use?
Accuracy vs F1 vs ROC-AUC decision tree (diagram)
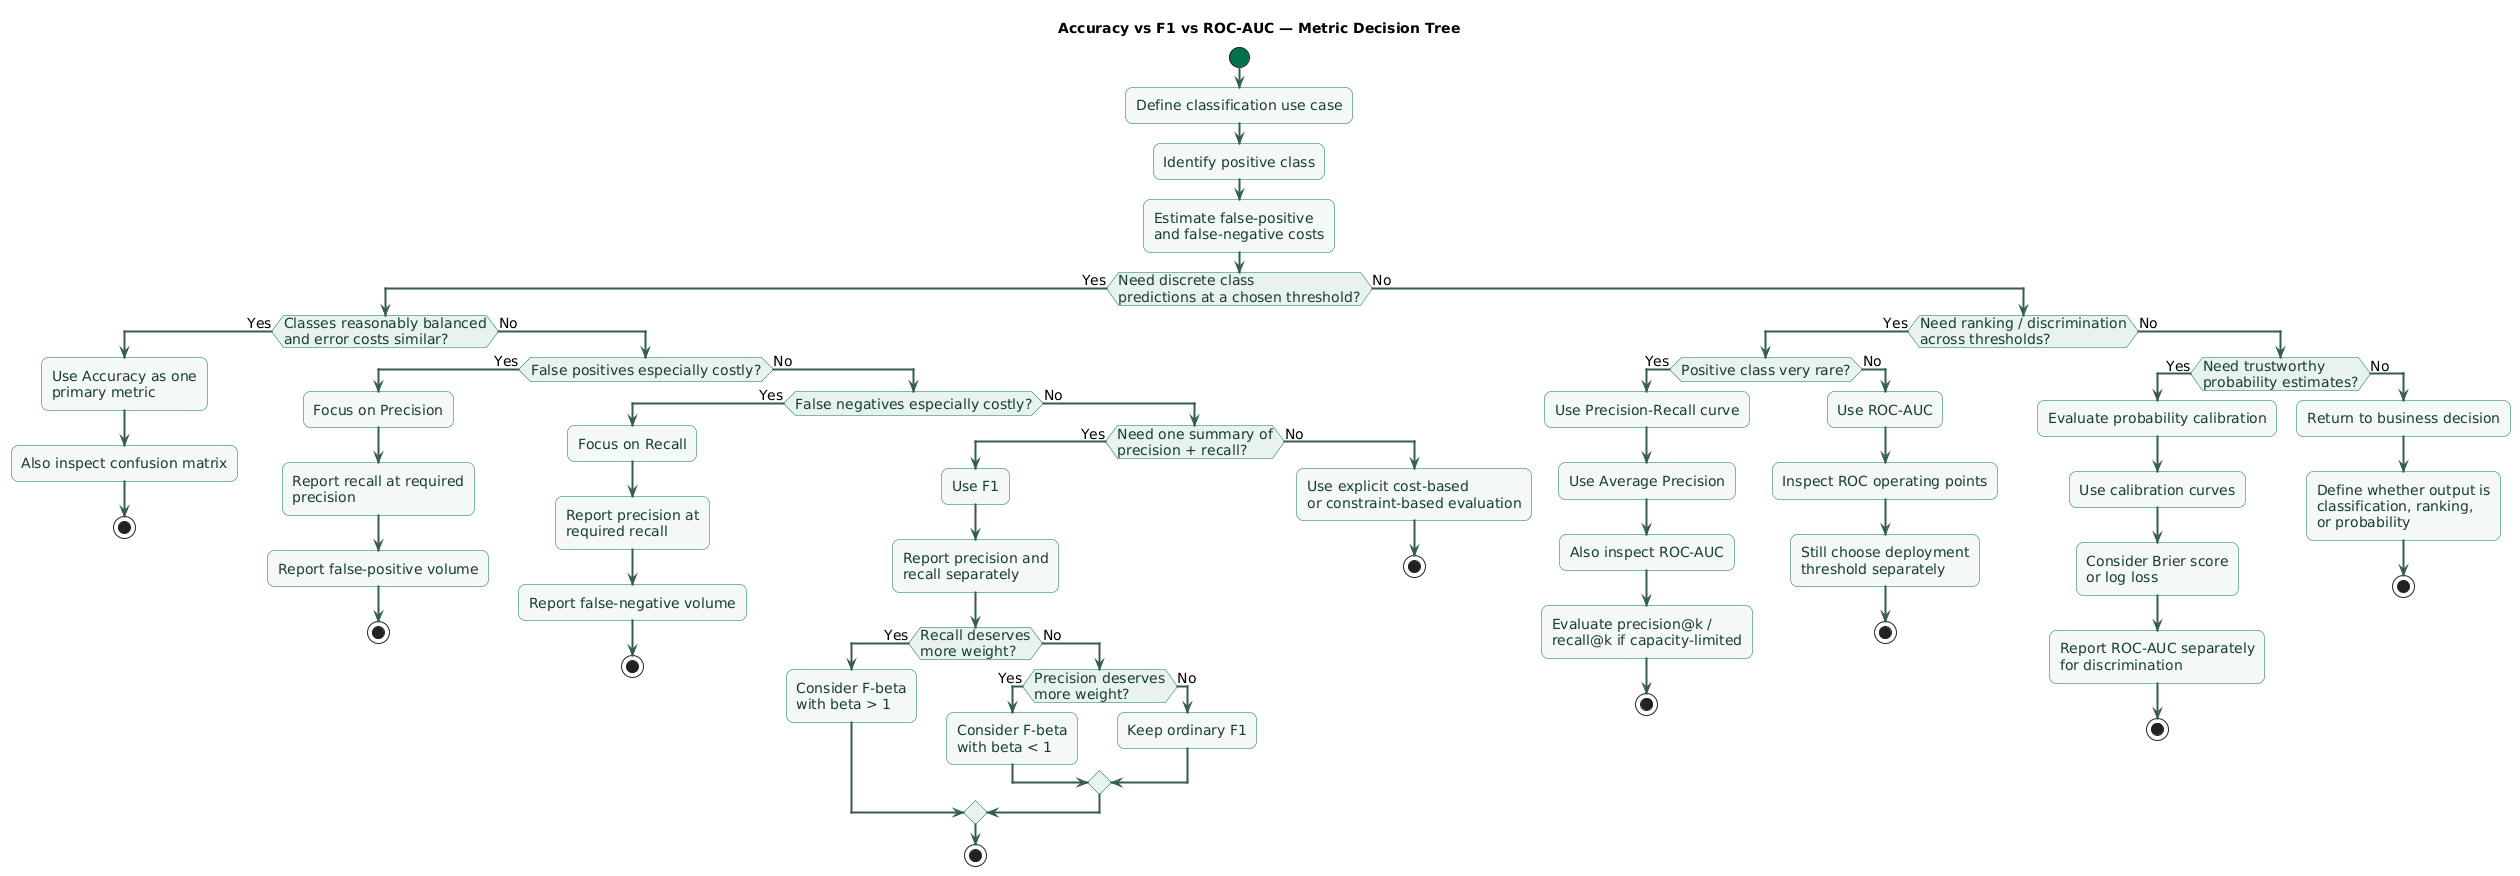
| Use case | Useful primary view | Also inspect |
|---|---|---|
| Balanced classes, similar error costs | Accuracy | Confusion matrix |
| Rare positive class | Precision / recall or Average Precision | ROC-AUC, confusion matrix |
| Both precision and recall matter | F1 | Precision and recall separately |
| Missing positives is very costly | Recall | Precision at required recall |
| False alerts are very costly | Precision | Recall at required precision |
| Ranking candidates | ROC-AUC or ranking-oriented metric | Top-k operational performance |
| Rare-event ranking | Precision-recall / Average Precision | Precision at k, recall at k |
| Probability used as risk estimate | Calibration-sensitive metrics | ROC-AUC plus calibration analysis |
Fraud screening
If an investigation team can review only 500 transactions per day, the relevant question may be:
How many actual fraud cases are present among the top 500 alerts?
Global accuracy may contribute almost nothing to that decision.
Medical screening
Missing a serious condition may have a much greater cost than referring a healthy patient for another test. High recall may therefore be required, followed by measurement of precision and downstream workload at that recall.
Spam filtering
A false positive may hide a legitimate email. Depending on the product, precision for the spam class can be more important than maximizing raw recall.
Lead ranking
If sales representatives contact the 100 highest-scoring leads rather than classifying every lead using one fixed threshold, top-k precision, lift-style measures, or ranking performance may align better with the workflow.
9. Ranking quality is not probability quality
Imagine a model reports:
customer A: 0.90
customer B: 0.70
customer C: 0.20
ROC-AUC primarily cares whether positive observations tend to rank above negative ones.
It does not by itself guarantee that events receiving a score of 0.70 actually occur about 70% of the time.
Discrimination
Can the model rank higher-risk observations above lower-risk ones?
Calibration
Do estimated probabilities correspond reasonably to observed frequencies?
These are different properties.
When calibration matters
- Expected financial loss calculations.
- Risk-based pricing.
- Resource allocation based on estimated probability.
- Decision analysis using probability multiplied by cost.
In those cases, evaluate probability-sensitive measures and calibration plots in addition to discrimination metrics.
10. Build a metric dashboard instead of choosing one magic number
A useful classification report usually contains more than one metric.
Minimum binary-classification report
from sklearn.metrics import (
    accuracy_score,
    precision_score,
    recall_score,
    f1_score,
    roc_auc_score,
    average_precision_score,
    confusion_matrix
)

metrics = {
    "accuracy": accuracy_score(
        y_test,
        y_pred
    ),
    "precision": precision_score(
        y_test,
        y_pred,
        zero_division=0
    ),
    "recall": recall_score(
        y_test,
        y_pred,
        zero_division=0
    ),
    "f1": f1_score(
        y_test,
        y_pred,
        zero_division=0
    ),
    "roc_auc": roc_auc_score(
        y_test,
        y_probability
    ),
    "average_precision": average_precision_score(
        y_test,
        y_probability
    )
}

print(metrics)
print(confusion_matrix(y_test, y_pred))
Report the threshold
Precision, recall, F1, accuracy, and the confusion matrix depend on class predictions, which depend on the threshold.
evaluation = {
    "threshold": 0.35,
    "precision": 0.81,
    "recall": 0.92,
    "f1": 0.86
}
The threshold belongs in the evaluation report.
Report class prevalence
positive_rate = y_test.mean()

print(
    f"Positive prevalence: "
    f"{positive_rate:.2%}"
)
Precision in particular can change when the prevalence of positive cases changes between evaluation and deployment.
Evaluate important segments
A strong global score can hide poor performance for:
- One country.
- One device type.
- One product.
- One customer segment.
- One time period.
for segment, group in test_df.groupby(
    "customer_segment"
):
    precision = precision_score(
        group["target"],
        group["prediction"],
        zero_division=0
    )

    recall = recall_score(
        group["target"],
        group["prediction"],
        zero_division=0
    )

    print(
        segment,
        precision,
        recall
    )
Track counts in production
Alongside rates, monitor:
- Predicted positives per day.
- Review workload.
- Confirmed positives.
- False positive count.
- False negative count where labels eventually arrive.
- Class prevalence.
- Score distribution.
A model metric is a compressed story
Whenever one score becomes the headline, preserve the confusion matrix, class prevalence, threshold, and error counts behind it. Those details explain what the headline number actually means.
11. Copy/paste classification-metrics checklist
Classification metrics checklist

Problem definition
- Define the positive class explicitly.
- Define what happens after a positive prediction.
- Define what happens after a negative prediction.
- Estimate the cost of a false positive.
- Estimate the cost of a false negative.
- Identify operational capacity constraints.
- Decide whether the model performs classification, ranking, or probability estimation.

Dataset
- Measure positive-class prevalence.
- Compare prevalence across train, validation, and test.
- Compare prevalence with expected production data.
- Use validation splits that match production.
- Check important subgroups.
- Check temporal changes in prevalence.

Confusion matrix
- Report true positives.
- Report false positives.
- Report false negatives.
- Report true negatives.
- Convert rates into expected real-world counts.
- Review confusion matrices by important segment.

Accuracy
- Compare accuracy with majority-class accuracy.
- Do not use accuracy alone on strongly imbalanced data.
- Check whether false positives and false negatives have similar costs.
- Consider balanced accuracy when class recalls deserve equal weighting.
- Report the confusion matrix beside accuracy.

Precision
- Use precision when false positives are costly.
- Report the number of predicted positives.
- Check precision at the production threshold.
- Check whether deployment prevalence differs from validation prevalence.
- Translate precision into expected false-alert volume.

Recall
- Use recall when missing positives is costly.
- Report the number of positive cases missed.
- Evaluate precision at the required recall.
- Check recall across important subgroups.
- Check whether labels allow reliable false-negative measurement.

F1
- Use F1 when precision and recall both matter.
- Remember that F1 ignores true negatives.
- Remember that F1 depends on the decision threshold.
- Report precision and recall separately beside F1.
- Consider F-beta when recall and precision have unequal importance.
- Do not maximize F1 automatically when business costs are asymmetric.

ROC-AUC
- Use ROC-AUC to assess ranking discrimination across thresholds.
- Calculate ROC-AUC from scores or probabilities, not thresholded labels.
- Do not treat ROC-AUC as a production threshold.
- Do not assume strong ROC-AUC means high precision.
- Do not assume strong ROC-AUC means calibrated probabilities.
- Inspect operational points on the ROC curve.
- Convert false-positive rate into expected false-positive counts.

Precision-recall
- Inspect the precision-recall curve when positives are rare.
- Use Average Precision as a summary where appropriate.
- Report precision at important recall levels.
- Report recall at important precision levels.
- Do not confuse Average Precision with a simple trapezoidal PR area.
- Compare PR performance with class prevalence.

Threshold selection
- Do not assume 0.5 is automatically optimal.
- Tune the threshold on validation data.
- Do not tune the threshold on the final test set.
- Evaluate precision across candidate thresholds.
- Evaluate recall across candidate thresholds.
- Evaluate F1 or F-beta across candidate thresholds where useful.
- Evaluate real false-positive and false-negative costs.
- Include operational review capacity.
- Freeze the threshold before final test evaluation.
- Version the production threshold with the model.

Probability quality
- Separate ranking performance from probability calibration.
- Evaluate calibration when probabilities drive decisions.
- Inspect predicted-probability distributions.
- Consider Brier score or log loss when probability quality matters.
- Do not infer calibration from ROC-AUC alone.

Ranking use cases
- Ask whether users consume only the top-k predictions.
- Measure precision at k when appropriate.
- Measure recall at k when appropriate.
- Evaluate ranking under actual operational capacity.
- Do not rely on global classification accuracy for ranking-only workflows.

Multiclass problems
- Define macro, micro, or weighted averaging explicitly.
- Inspect per-class metrics.
- Do not rely only on one aggregate multiclass score.
- Check minority classes separately.
- Review the multiclass confusion matrix.

Validation
- Use the same metric definition across experiments.
- Keep validation splits fixed where appropriate.
- Calculate confidence intervals or cross-validation variability when useful.
- Inspect performance across folds.
- Inspect performance over time.
- Inspect performance across key segments.
- Investigate unexpectedly excellent metrics for leakage.

Final test set
- Choose metrics before inspecting final test results.
- Choose the threshold before final test evaluation.
- Do not repeatedly tune against the final test set.
- Report all agreed primary and secondary metrics.
- Report the confusion matrix.
- Report class prevalence.
- Report the production threshold.

Production monitoring
- Monitor class-score distributions.
- Monitor positive prediction rate.
- Monitor alert or review volume.
- Monitor class prevalence when labels arrive.
- Monitor precision when confirmed outcomes arrive.
- Monitor recall when false negatives can be measured.
- Monitor performance by important subgroup.
- Monitor changes in business costs or capacity.
- Revisit the decision threshold when operating conditions materially change.

Final questions
- What decision is the model supporting?
- Which error matters more?
- Is the positive class rare?
- Is the output used as a label, ranking, or probability?
- Is the selected metric threshold-dependent?
- Does the evaluation reflect production prevalence?
- Can the operational team handle the predicted-positive volume?
- Are probabilities required to be calibrated?
- Are subgroup results acceptable?
- Can the chosen metric be translated into real-world consequences?
12. FAQ
Why can high accuracy be misleading?
Accuracy counts every correct prediction in the same denominator. When one class dominates, predicting that class almost everywhere can produce high accuracy while completely failing on the rare class. Compare accuracy with the majority baseline and confusion matrix.
When should I use F1 instead of accuracy?
F1 is useful when the positive class matters and you want a single number combining precision and recall. It becomes less suitable when true negatives matter strongly or when false-positive and false-negative costs are very different.
Does a high ROC-AUC mean a classifier is good in production?
Not automatically. ROC-AUC measures discrimination across many possible thresholds. Production still needs a specific threshold or ranking policy, acceptable false-positive volume, and possibly well-calibrated probabilities.
Should I use ROC-AUC or precision-recall for imbalanced data?
Inspect both when useful, but precision-recall is often particularly informative when the positive class is rare and you care about how many predicted positives are correct. Average Precision can summarize that precision-recall relationship.
Should the classification threshold always be 0.5?
No. The useful threshold depends on error costs, operating capacity, class prevalence, model scores, and required precision or recall. Select it using validation data rather than assuming the default is optimal.
Is F1 threshold-independent?
No. F1 is calculated from predicted labels, so changing the decision threshold changes the confusion matrix and therefore changes precision, recall, and F1.
Key terms (quick glossary)
- Accuracy
- The fraction of predictions whose predicted class equals the true class.
- Precision
- The fraction of predicted positive observations that are actually positive.
- Recall
- The fraction of actual positive observations successfully identified by the classifier. Also called sensitivity or true positive rate.
- F1 score
- The harmonic mean of precision and recall, giving them equal emphasis while ignoring true negatives.
- F-beta score
- A generalization of F1 that allows recall or precision to receive greater relative weight.
- False positive rate
- The fraction of actual negative examples incorrectly classified as positive.
- ROC curve
- A curve showing true positive rate against false positive rate as the classification threshold changes.
- ROC-AUC
- The area under the ROC curve, summarizing discrimination or ranking behavior across possible thresholds.
- Precision-recall curve
- A curve showing how precision and recall change as the score threshold moves.
- Average Precision
- A summary of precision-recall performance that weights precision values by increases in recall across thresholds.
- Decision threshold
- The score boundary used to convert a continuous classifier output into a discrete predicted class.
- Calibration
- The degree to which predicted probabilities correspond to observed outcome frequencies.
- Class imbalance
- A situation in which one classification class occurs much more frequently than another.
Worth reading
Recommended guides from the category.