
Model explainability often begins with an innocent question: “Which features matter most?”
Unfortunately, that question is underspecified.
You may be asking which features the model relies on for validation performance, why one customer received a particular prediction, which variables usually push predictions higher, whether the model learned a suspicious shortcut, or whether two correlated variables are carrying the same information.
SHAP and permutation importance can both help, but they answer different versions of those questions.
Do not ask for “the” feature importance
Feature importance is not one universal property of a dataset. It depends on the fitted model, the evaluation data, the metric, the explanation method, and how dependent features are handled.
1. Start with the explanation question
SHAP vs permutation importance decision flow (diagram)
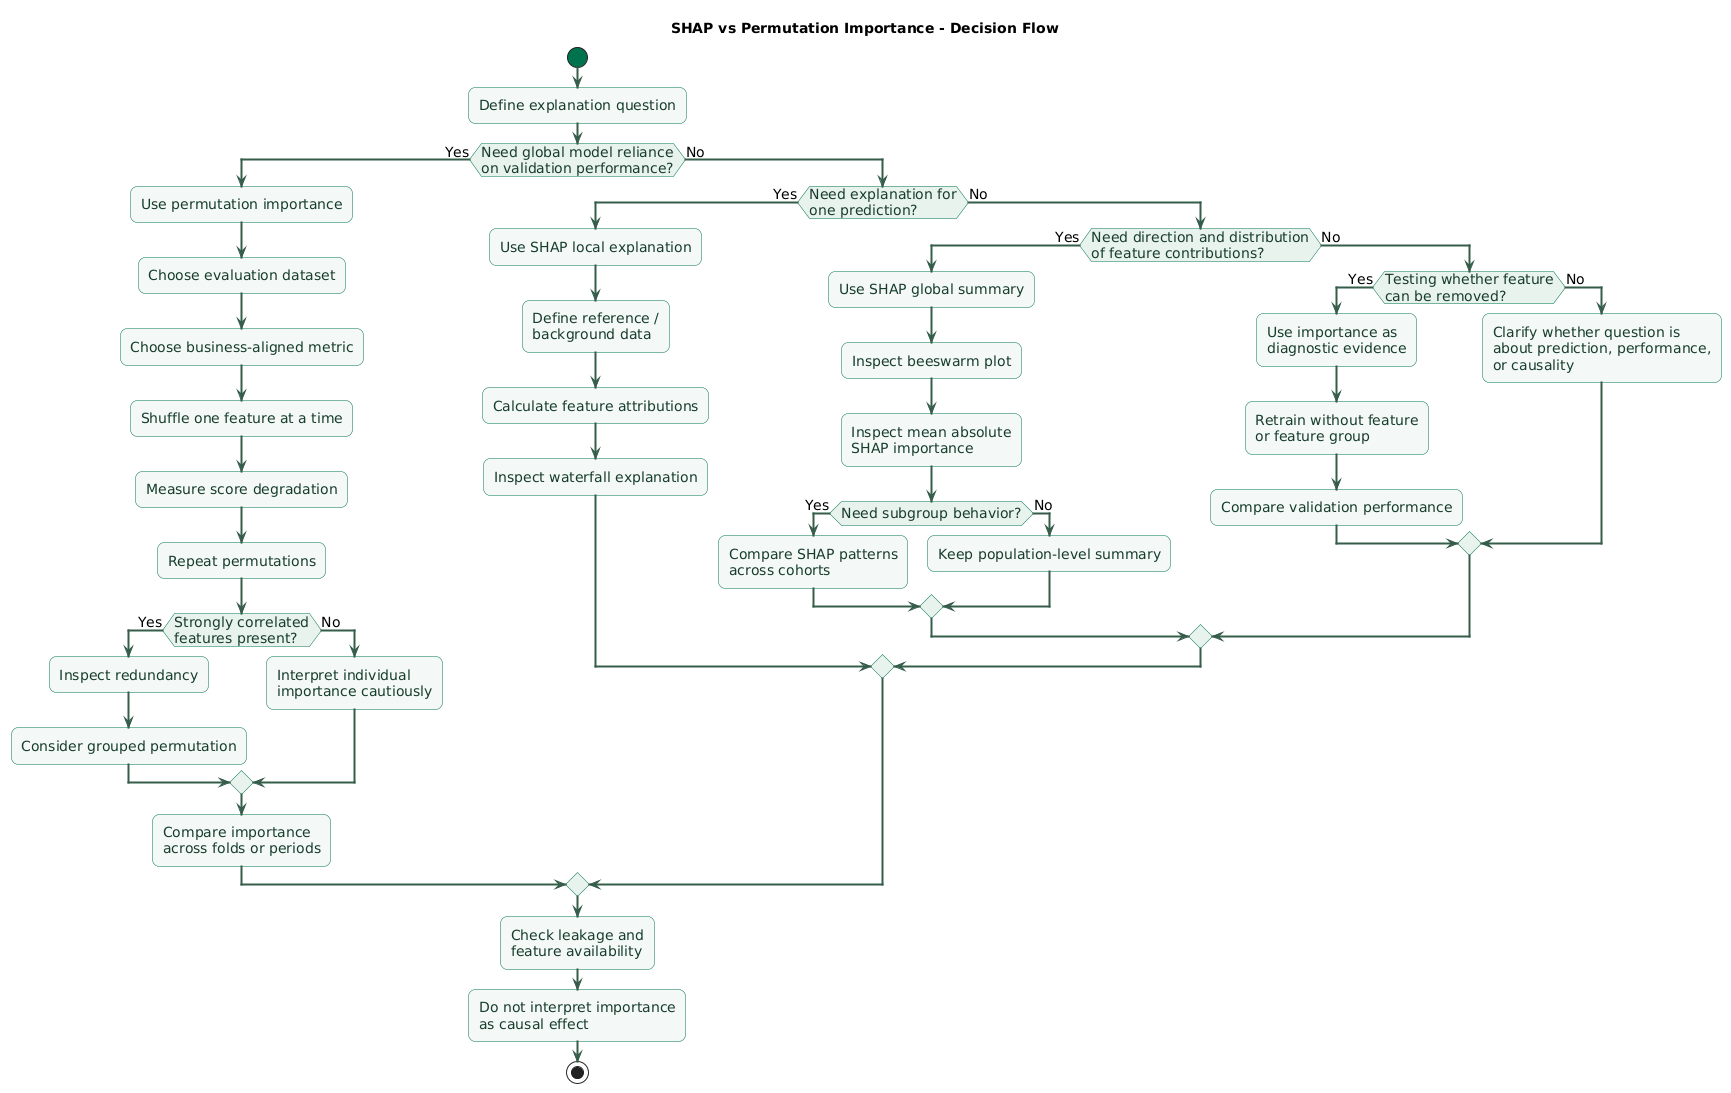
Before running an explainer, write the question in operational language.
Question A: What does the model rely on for predictive performance?
Permutation importance is often a good starting point.
It can answer:
If I destroy the information in this feature, how much does my selected model score deteriorate?
Question B: Why did the model score this observation so highly?
SHAP is designed for this kind of local attribution.
It can show which input features pushed the model output away from a baseline for that particular observation.
Question C: Which features usually push predictions higher or lower?
Aggregate SHAP plots are often useful because they retain both attribution magnitude and direction across many observations.
Question D: Can we safely remove a feature?
Neither method alone answers this completely.
Retrain the model without the feature or feature group and validate the resulting model. Importance inspection can identify candidates, but retraining tests the actual alternative model.
Question E: Did the model learn a suspicious shortcut?
Use several views:
- Validation permutation importance.
- SHAP summaries.
- Individual suspicious predictions.
- Correlation analysis.
- Feature availability and leakage audit.
2. What permutation importance actually measures
Permutation importance starts with a fitted model and a dataset.
The basic algorithm is:
- Calculate the model's baseline score.
- Shuffle one feature column.
- Score the model again.
- Measure the decrease in score.
- Repeat the shuffle several times.
- Repeat for every feature.
importance(feature) =
    baseline_score
    - score_after_permuting_feature
scikit-learn example
from sklearn.inspection import (
    permutation_importance
)

result = permutation_importance(
    model,
    X_valid,
    y_valid,
    scoring="roc_auc",
    n_repeats=20,
    random_state=42,
    n_jobs=-1
)

importance = (
    pd.DataFrame({
        "feature": X_valid.columns,
        "importance_mean":
            result.importances_mean,
        "importance_std":
            result.importances_std
    })
    .sort_values(
        "importance_mean",
        ascending=False
    )
)

print(importance)
The unit is score degradation
If ROC-AUC falls from 0.84 to approximately 0.73 when a feature is permuted, the model's ranking performance depends strongly on the information represented by that feature in this evaluation set.
Importance depends on the metric
A feature may be very important for recall and less important for precision.
For regression, ranking by MAE degradation can differ from ranking by squared-error degradation.
Therefore:
permutation importance
≠ intrinsic feature value

permutation importance
= model reliance
  for a dataset
  under a chosen score
Use a model worth interpreting
If the model barely performs better than a trivial baseline, its feature importance ranking may tell you how a weak model behaves rather than how useful the available signal is.
Validate predictive performance first.
Held-out permutation importance
Calculating importance on validation data is especially useful when the question is:
Which features does the trained model rely on to generalize?
Comparing train and validation importance can also reveal features that matter strongly only in-sample.
3. What SHAP values actually explain
SHAP values provide additive feature attributions for model outputs.
For one observation, think conceptually:
baseline model output
+ feature A contribution
+ feature B contribution
+ feature C contribution
+ ...
= explained model output
Positive and negative contributions describe how features move the explained model output relative to the explainer's baseline.
Basic SHAP example
import shap

explainer = shap.Explainer(
    model,
    X_background
)

shap_values = explainer(
    X_explain
)
Explain one prediction
shap.plots.waterfall(
    shap_values[0]
)
A waterfall plot is useful when reviewing one customer, transaction, application, machine event, or other individual model decision.
Global SHAP summary
shap.plots.beeswarm(
    shap_values
)
A beeswarm plot summarizes feature attributions across many observations. It can show:
- Which features have large attribution magnitudes.
- Whether high feature values tend to move predictions up or down.
- Whether attribution effects vary substantially across observations.
Global SHAP importance
shap.plots.bar(
    shap_values
)
A global SHAP bar summary commonly aggregates the absolute attribution magnitude across the supplied observations.
That is not the same quantity as permutation importance. One summarizes attribution magnitude; the other measures score degradation after information is disrupted.
TreeExplainer
Tree-based models often have an efficient specialized SHAP implementation.
explainer = shap.TreeExplainer(
    model,
    data=X_background
)

values = explainer(
    X_explain
)
The exact output scale and feature-dependence assumptions matter, so record the explainer configuration as part of the analysis.
SHAP explains the model, not reality
A positive SHAP contribution means a feature pushed the model output in a particular direction under the explainer's assumptions. It does not establish that changing the real-world feature would causally change the outcome.
4. Global importance vs local explanations
Global and local model explanation layers (diagram)
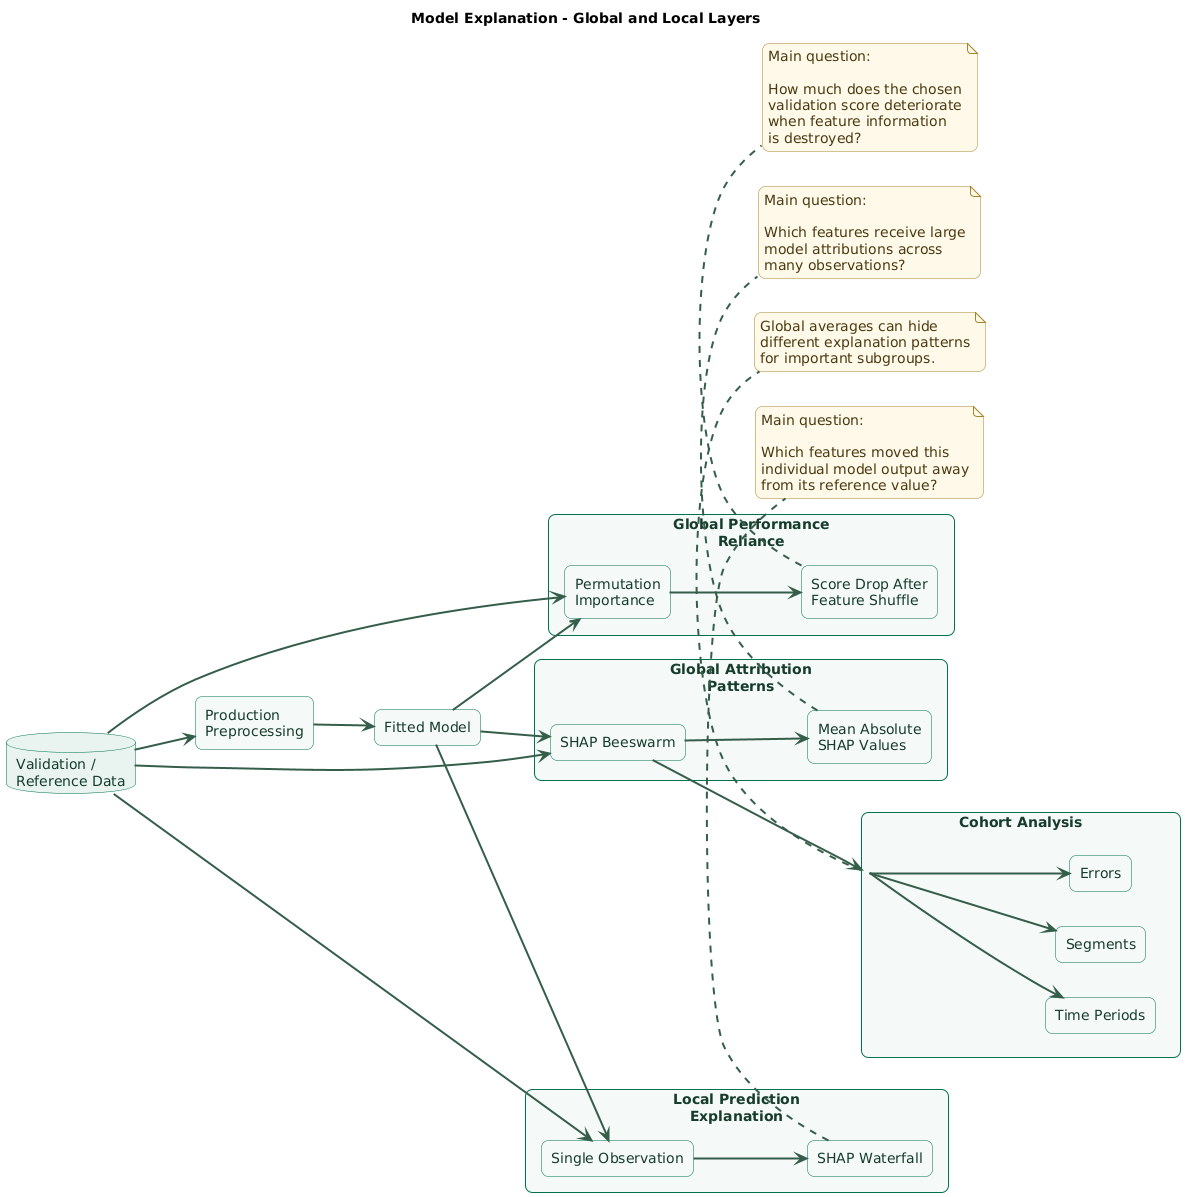
Global question
“What variables does this model generally depend on?”
Useful tools:
- Permutation importance.
- Mean absolute SHAP values.
- SHAP beeswarm plots.
- Partial dependence or ICE when appropriate.
Local question
“Why did this individual prediction differ from the model's normal baseline?”
SHAP is the clearer fit.
Cohort question
Sometimes the important unit is neither one record nor the entire population.
Compare explanation behavior for:
- New vs existing customers.
- Countries.
- Product lines.
- Device types.
- Prediction-error groups.
- Different time periods.
A globally modest feature may dominate predictions for one operationally important group.
Do not collapse everything into a top-ten bar chart
A ranking cannot show:
- Direction of effect.
- Different behavior across observations.
- Interactions.
- Subgroup-specific patterns.
- Prediction-specific reasons.
Use the ranking as a navigation tool, not as the complete explanation.
5. Correlated features can mislead both approaches
Suppose the model receives:
annual_income
monthly_income
These variables contain nearly the same information.
Permutation importance problem
If you shuffle annual_income, the model may still recover
income information through monthly_income.
The score may barely change, producing low permutation importance for the first feature.
Shuffle monthly_income instead and the model may still rely on
annual_income.
You can therefore obtain:
annual_income:
low individual importance

monthly_income:
low individual importance

income information as a group:
very important
Grouped permutation
When several variables represent one conceptual signal, permuting them together can answer a more meaningful question:
How much does performance deteriorate when the model loses this whole information group?
SHAP also needs assumptions about feature dependence
Attribution requires reasoning about what it means for a feature to be absent or integrated out.
When inputs are dependent, different assumptions about feature dependence can distribute attribution differently.
Inspect correlation before interpreting rankings
corr = (
    X_valid
      .select_dtypes(include="number")
      .corr()
      .abs()
)

print(corr)
Correlation is not the only form of dependence, but it is a useful first diagnostic for tabular numerical features.
Prefer domain groups
Consider grouping:
customer size:
- employees
- annual revenue
- number of locations

recent activity:
- events_7d
- events_14d
- events_30d

price:
- list price
- discount
- final price
The business concept can be more stable and interpretable than the exact distribution of importance among redundant columns.
6. Evaluation data, background data, and preprocessing matter
Permutation importance depends on evaluation data
If you calculate importance on:
- Training data.
- Random validation data.
- A recent time period.
- One geographic region.
you may obtain different rankings.
This is not necessarily a bug. The model may rely on different information in different populations.
Use the population that matches your question
If you want to understand production behavior in July 2026, importance on a broad training set from 2022 through 2026 may answer a different question.
SHAP background data matters
Many SHAP configurations use a background dataset or a masker to define the reference distribution used while constructing explanations.
A background set drawn from a very different population can make the explanation baseline less representative of the observations you are analyzing.
Choose representative background observations
Depending on the model and explainer, consider a manageable sample from the relevant training or reference population rather than blindly passing every available row.
Explain the production pipeline
Suppose your model receives:
age
income
country_BE
country_FR
country_PL
but users think in terms of:
age
income
country
Raw transformed-column explanations may be technically correct but difficult to communicate.
Keep mappings from transformed features to original business concepts so related one-hot columns or generated features can be presented coherently.
Pipeline mismatch is a serious explanation bug
Do not explain a model using manually preprocessed data that differs from the transformations used during prediction.
The explanation path should reproduce:
raw input
   ↓
production preprocessing
   ↓
fitted model
   ↓
explanation
7. A practical SHAP and permutation-importance workflow
Model explanation validation workflow (diagram)

Step 1: validate predictive performance
Before explaining the model, confirm it performs adequately under the evaluation scheme relevant to production.
score = roc_auc_score(
    y_valid,
    model.predict_proba(X_valid)[:, 1]
)

print(score)
Step 2: calculate permutation importance
Use a held-out dataset and the primary model metric.
permutation = permutation_importance(
    model,
    X_valid,
    y_valid,
    scoring="roc_auc",
    n_repeats=30,
    random_state=42,
    n_jobs=-1
)
Step 3: inspect uncertainty across permutations
Do not rank by the mean and ignore variability.
importance_df = pd.DataFrame({
    "feature": X_valid.columns,
    "mean": permutation.importances_mean,
    "std": permutation.importances_std
})
Features whose order changes substantially across repetitions deserve less confidence as precisely ranked items.
Step 4: inspect correlated or redundant features
Identify groups where individual permutation scores may underestimate the importance of shared information.
Step 5: calculate SHAP values for representative observations
background = X_train.sample(
    n=min(500, len(X_train)),
    random_state=42
)

explain_data = X_valid.sample(
    n=min(1000, len(X_valid)),
    random_state=42
)

explainer = shap.Explainer(
    model,
    background
)

values = explainer(
    explain_data
)
The appropriate explainer and background strategy depend on the model and your interpretation assumptions.
Step 6: inspect global SHAP behavior
shap.plots.beeswarm(values)Compare the SHAP summary with permutation importance.
Disagreement is not automatically an error. The methods measure different things.
Step 7: inspect individual predictions
shap.plots.waterfall(
    values[0]
)
Choose examples deliberately:
- High-confidence true positives.
- High-confidence false positives.
- False negatives.
- Predictions close to the decision threshold.
- Operationally important customers or events.
Step 8: analyze cohorts
Compare explanation distributions between meaningful groups rather than assuming one global pattern applies everywhere.
Step 9: perform a leakage and plausibility audit
A feature with suspiciously dominant importance may be:
- A post-outcome field.
- A proxy for the target.
- An identifier.
- A timestamp encoded incorrectly.
- A feature available during training but unavailable at prediction time.
Explanation tools can expose the symptom. They do not prove the underlying pipeline is legitimate.
8. When to use which method
| Question | Recommended starting point |
|---|---|
| Which features support validation performance? | Permutation importance |
| Why did one prediction become high? | SHAP local explanation |
| Which features usually move predictions? | SHAP global summary |
| Does importance change with scoring metric? | Permutation importance with multiple scorers |
| Which feature groups contain redundant information? | Correlation analysis plus grouped permutation |
| Why are false positives happening? | SHAP on false-positive cohort |
| Can this feature be removed safely? | Retraining ablation, supported by importance analysis |
| Did the model learn a leakage shortcut? | Both methods plus data audit |
Use permutation importance first for model debugging
It is simple, model-agnostic, directly connected to a chosen evaluation metric, and easy to run on held-out data.
That makes it a useful first global inspection tool.
Add SHAP when local behavior matters
SHAP becomes especially useful when you need to explain:
- Individual predictions.
- Direction of contribution.
- Different explanation patterns across records.
- Error cohorts.
- Operational review cases.
Use both when the model matters
For important models, the strongest workflow is often not SHAP versus permutation importance.
It is:
performance validation
        ↓
permutation importance
        ↓
correlation / redundancy audit
        ↓
SHAP global patterns
        ↓
SHAP local cases
        ↓
cohort analysis
        ↓
domain + leakage review
9. Common interpretation mistakes
Mistake 1: importance means causality
A feature can be highly predictive because it is correlated with the outcome without causing it.
Model explainability tools describe model behavior. Causal conclusions require an appropriate causal design and assumptions.
Mistake 2: zero permutation importance means useless feature
A correlated substitute may preserve the same signal after one column is shuffled.
Also remember that permutation importance describes the fitted model. A differently trained model may use the feature differently.
Mistake 3: high SHAP magnitude means safe feature
A leaky post-outcome feature can receive enormous attribution precisely because the model relies on it.
Mistake 4: feature ranking is stable forever
Importance can change when:
- The model is retrained.
- The population changes.
- The feature distribution drifts.
- The metric changes.
- The background sample changes.
- The model hyperparameters change.
Mistake 5: explaining transformed columns without context
An explanation involving:
country_BE
country_FR
plan_enterprise
revenue_log1p
age_scaled
may require mapping back to business concepts before it becomes useful to a stakeholder.
Mistake 6: interpreting a poor model deeply
Explaining a weak classifier in great detail can produce a precise story about unreliable predictions.
Predictive validity comes before interpretability analysis.
10. Test explanation stability
Explanations should be treated as estimated model diagnostics, not as immutable facts.
Repeat permutation importance
Use multiple permutations and inspect the resulting spread.
Compare across validation folds
Calculate importance independently across cross-validation folds or historical periods.
fold 1:
age              0.041
income           0.038
recent_activity  0.011

fold 2:
income           0.044
age              0.036
recent_activity  0.013

fold 3:
recent_activity  0.049
income           0.030
age              0.028
Fold 3 may indicate a different population, drift, or an unstable ranking.
Compare SHAP across cohorts
Rather than relying on one global beeswarm, inspect whether the same features dominate:
- Recent vs historical data.
- Low- vs high-confidence predictions.
- Correct vs incorrect predictions.
- Different business segments.
Check explanation sensitivity to background data
If changing the SHAP reference population materially changes the story, that sensitivity belongs in your interpretation.
Retrain without suspicious features
If a feature looks redundant, leaky, unstable, or operationally unavailable, the strongest test is often:
Model A:
all features

Model B:
remove suspicious feature / group

Compare:
- cross-validation performance
- final holdout performance
- stability
- subgroup behavior
- operational simplicity
This directly tests whether the model can perform without the information.
Use explanations to generate tests
The best outcome of model interpretation is often a better experiment: remove a suspicious feature, retrain, evaluate another time period, inspect a subgroup, or test whether the same pattern survives a different model.
11. Copy/paste model-explanation checklist
SHAP vs permutation importance checklist

Before explanation
- Define the prediction task.
- Define the production population.
- Define the primary evaluation metric.
- Confirm the model beats a meaningful baseline.
- Confirm validation is leakage-safe.
- Confirm features exist at prediction time.
- Identify important subgroups.
- Identify correlated or redundant features.

Define the question
- Do you need global model reliance?
- Do you need local prediction attribution?
- Do you need direction of contribution?
- Do you need cohort-level explanation?
- Are you debugging model errors?
- Are you investigating leakage?
- Are you evaluating feature removal?
- Are you communicating predictions to stakeholders?

Permutation importance
- Use a fitted model.
- Prefer held-out data for generalization-focused importance.
- Use the metric that matches the model objective.
- Record the baseline score.
- Repeat permutations multiple times.
- Record mean importance.
- Record importance variability.
- Use a reproducible random seed.
- Compare train and validation importance where useful.
- Do not interpret a poor model deeply.
- Remember importance belongs to this model and dataset.

Metric dependence
- Calculate importance using the primary metric.
- Consider secondary metrics where operationally meaningful.
- Check whether rankings change across metrics.
- Document the scoring function.
- Do not compare importance magnitudes across unrelated metric scales casually.

Correlated features
- Inspect numerical correlations.
- Identify duplicated information.
- Identify transformed versions of the same raw feature.
- Identify related lag features.
- Identify one-hot groups.
- Interpret redundant features together.
- Consider grouped permutation.
- Do not conclude that low individual permutation importance means no predictive information.

SHAP setup
- Choose an explainer appropriate for the model.
- Record the explainer type.
- Record the explained model output.
- Define representative background data where required.
- Keep background data versioned.
- Use representative explanation samples.
- Keep feature names.
- Preserve mapping from transformed features to original concepts.

SHAP local explanations
- Inspect selected individual predictions.
- Include true positives where relevant.
- Include true negatives where relevant.
- Include false positives.
- Include false negatives.
- Include threshold-adjacent predictions.
- Include operationally important cases.
- Interpret contributions relative to the explanation baseline.
- Do not call SHAP contributions causal effects.

SHAP global explanations
- Inspect mean absolute attribution summaries.
- Inspect beeswarm distributions.
- Check contribution direction.
- Look for heterogeneous effects.
- Compare important cohorts.
- Compare time periods.
- Investigate unexpected dominant features.
- Do not treat a global bar plot as the entire explanation.

Preprocessing
- Explain the same pipeline used for prediction.
- Preserve column order.
- Preserve feature names.
- Track one-hot encoded groups.
- Track scaled features.
- Track logarithmic transforms.
- Track polynomial or interaction features.
- Map technical features back to business concepts.
- Avoid explaining manually transformed data that differs from production.

Leakage audit
- Investigate suspiciously dominant features.
- Check post-outcome timestamps.
- Check target-derived features.
- Check future aggregates.
- Check IDs and row-order proxies.
- Check data-source artifacts.
- Check fields unavailable at inference.
- Retrain after removing suspicious information.

Stability
- Repeat permutation importance.
- Compare importance across folds.
- Compare importance across time periods.
- Compare SHAP across cohorts.
- Compare explanations across model retraining runs.
- Check sensitivity to background data.
- Check whether top features remain top features.
- Treat unstable rankings cautiously.

Feature removal
- Use importance to identify candidates.
- Retrain without the feature.
- Retrain without correlated feature groups where appropriate.
- Compare validation performance.
- Compare subgroup performance.
- Compare calibration where relevant.
- Compare operational complexity.
- Do not remove features solely because one importance score is small.

Error analysis
- Explain false positives.
- Explain false negatives.
- Compare errors with correct predictions.
- Look for recurring explanation patterns.
- Check whether errors cluster around one feature.
- Check whether errors cluster around one subgroup.
- Check whether errors are associated with missing values.
- Check whether errors increase after distribution drift.

Communication
- Explain what the chosen method measures.
- Explain what the method does not measure.
- State the evaluation population.
- State the evaluation metric.
- State whether importance is global or local.
- State the SHAP baseline or reference context where relevant.
- Discuss correlated features.
- Avoid causal language unless causality has been established separately.
- Prefer business concepts over transformed-column names.

Production
- Version model explanations with the model.
- Save feature definitions.
- Save explainer configuration.
- Save background-data definition.
- Monitor major changes in importance.
- Monitor feature drift.
- Re-run explanations after substantial retraining.
- Investigate unexpected attribution shifts.
- Keep explanations reproducible.

Final review
- Is the model good enough to explain?
- Is the evaluation dataset representative?
- Does the importance metric match the real objective?
- Are correlated features being interpreted carefully?
- Does the explanation reproduce production preprocessing?
- Are SHAP values described as model attributions rather than causal effects?
- Have local and global views been kept distinct?
- Have suspicious features been audited for leakage?
- Has explanation stability been tested?
- Would retraining without the feature confirm the conclusion?
12. FAQ
What is the main difference between SHAP and permutation importance?
Permutation importance measures how much a selected model-performance score deteriorates when the information in one feature is disrupted. SHAP attributes an individual model output across its features relative to an explanation baseline. SHAP can then be aggregated across records for global summaries.
Should permutation importance be calculated on training or validation data?
Both can be informative, but held-out data is usually the better choice when the objective is understanding which features support generalization. Comparing training and validation importance can also reveal features the model relies on disproportionately in-sample.
Does a high SHAP value mean a feature caused the outcome?
No. SHAP describes how the fitted model's output is attributed under the explainer's assumptions. Predictive association and model attribution do not establish real-world causality.
Why do correlated features sometimes get low permutation importance?
When one feature is shuffled, a correlated feature may preserve much of the same signal. The model can continue performing well even though the underlying concept represented by the two variables is important.
Can I use SHAP for global feature importance?
Yes. SHAP values can be aggregated across observations, commonly through absolute attribution magnitudes, to create global summaries. That quantity is different from permutation importance and should not be interpreted as score degradation.
Which method should I use first?
For a global debugging pass, validation-set permutation importance is usually a simple starting point. Add SHAP when you need prediction-level explanations, direction of contribution, heterogeneous effects, or detailed cohort analysis.
Key terms (quick glossary)
- Model explainability
- Methods used to inspect and communicate how a predictive model behaves and which inputs influence its outputs.
- Feature importance
- A family of model-inspection quantities intended to summarize some form of feature influence or reliance. Its precise meaning depends on the method used.
- Permutation importance
- A model-inspection technique that measures the reduction in a chosen model score after one feature is randomly shuffled.
- SHAP value
- An additive feature attribution representing part of the difference between an explained model output and an explainer reference value.
- Local explanation
- An explanation describing one individual model prediction.
- Global explanation
- A summary of model behavior across many observations rather than one prediction.
- Background dataset
- Reference observations used by some SHAP explainers or maskers when evaluating feature contributions.
- TreeExplainer
- A SHAP explainer specialized for supported tree-based models and tree ensembles.
- Beeswarm plot
- A SHAP summary visualization displaying attribution distributions across many observations for multiple features.
- Waterfall plot
- A visualization showing how individual feature attributions move one prediction from its explanation baseline toward the model output.
- Feature dependence
- Statistical dependence between input variables, which can complicate feature attribution and permutation-based interpretation.
- Grouped permutation
- A variant of permutation analysis in which related features are shuffled together to measure the importance of their shared information.
- Ablation
- Retraining or reevaluating a model after removing a feature or feature group to measure its practical contribution to the modeling system.
Worth reading
Recommended guides from the category.