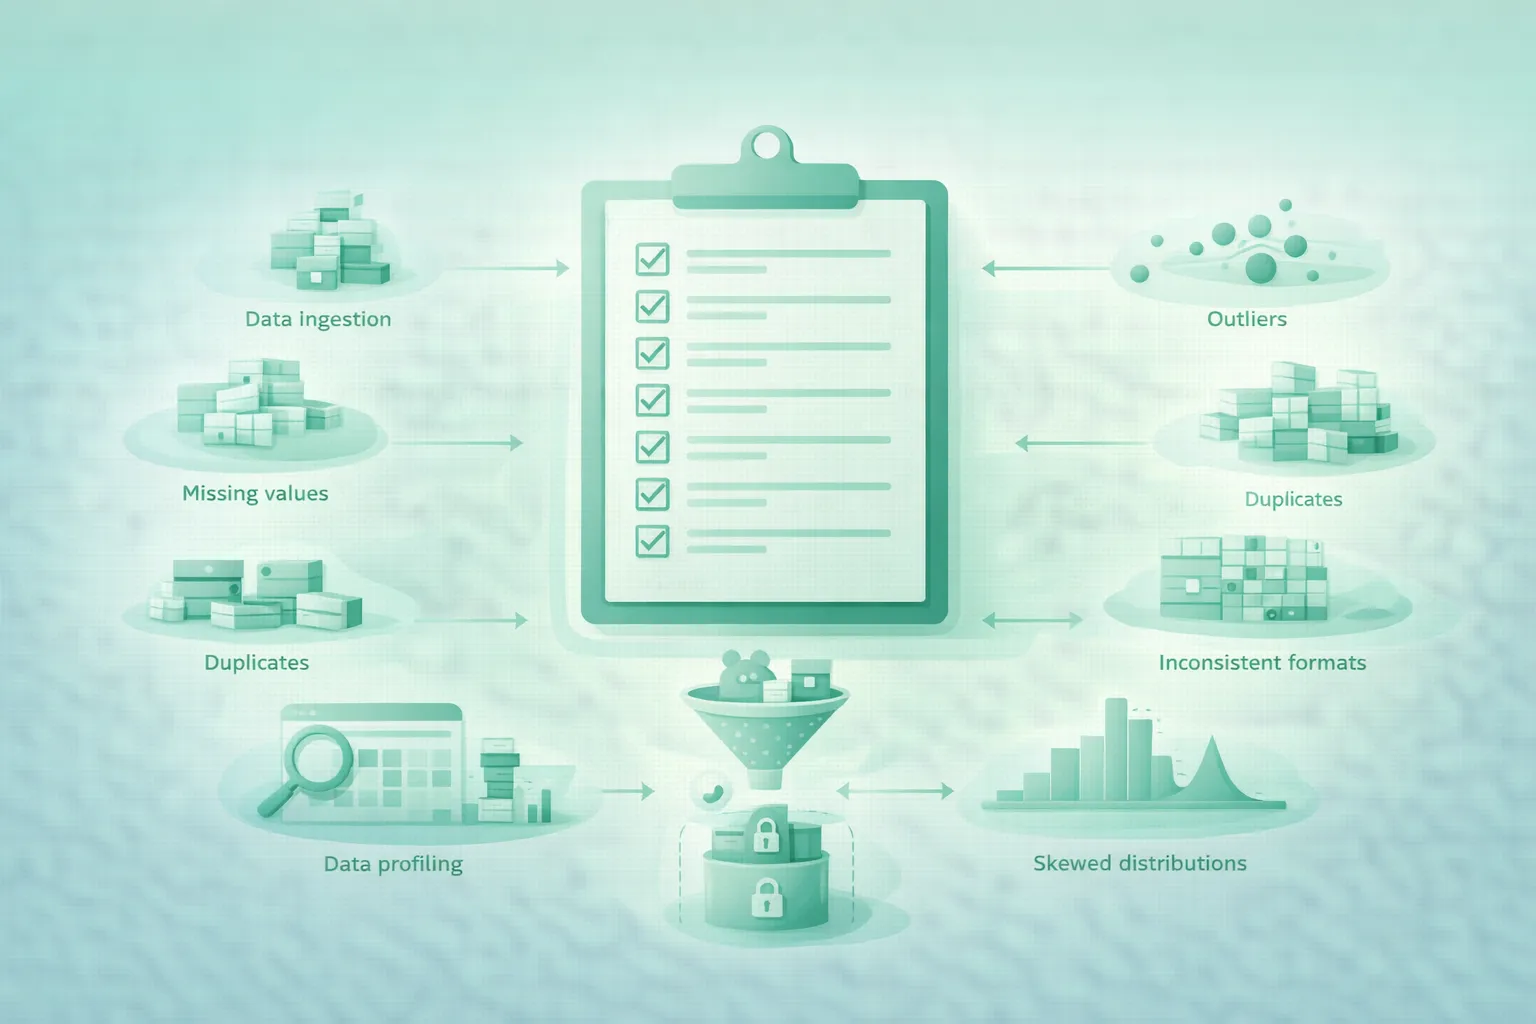
Real-world data rarely arrives as a clean rectangular table with perfect types, complete values, consistent units, and one row per entity. It arrives with duplicated exports, missing fields, inconsistent categories, mixed date formats, impossible values, changing schemas, and undocumented business rules.
That is why exploratory data analysis should begin before sophisticated modeling or visualization. The first goal is not to produce attractive charts. It is to understand what the dataset actually represents, where it can mislead you, and which assumptions need to be tested before the numbers become trustworthy.
EDA is an investigation, not a gallery of charts
A histogram is useful only when it answers a question. A duplicate count, failed uniqueness check, unexpected date range, or suspiciously predictive feature can be more important than dozens of visualizations.
1. What EDA should accomplish before modeling
A useful EDA process should leave you with a clear description of the dataset's structure, quality, limitations, and modeling risks.
Messy-data EDA workflow (diagram)

By the end of EDA, you should know
- What one row represents.
- How many rows and columns exist.
- Which fields can identify an entity or event.
- Which columns have incorrect or ambiguous types.
- Where missing values occur and whether the pattern is systematic.
- Whether duplicate rows or duplicate entities exist.
- Which categories are inconsistent or unexpectedly rare.
- Which numerical values are impossible, suspicious, or extreme.
- Which dates or timestamps fall outside the expected period.
- Whether units are consistent.
- How important variables are distributed.
- Which variables strongly relate to one another.
- Whether the target is imbalanced.
- Whether any feature leaks information unavailable at prediction time.
- Whether distributions differ by segment or time period.
Preserve the raw data first
Keep the original dataset immutable. Cleaning should create a new dataset or transformation layer rather than silently overwriting evidence of the original problem.
data/
├── raw/
│   └── customers_2026-08-20.csv
│
├── interim/
│   └── customers_normalized.parquet
│
└── processed/
    └── customers_model_ready.parquet
This makes every decision easier to audit and allows the analysis to be rerun when new data arrives.
2. Start with shape, schema, and data types
Before calculating correlations or plotting distributions, inspect the table itself.
Initial questions
- How many rows and columns exist?
- Are the column names unique?
- What does one row represent?
- Which fields should be identifiers?
- Are expected columns missing?
- Did unexpected columns appear?
- Which columns are numeric, categorical, dates, text, or boolean?
- Are some numeric values stored as strings?
- Are dates stored in multiple formats?
A minimal pandas inspection
import pandas as pd

df = pd.read_csv("data/raw/customers.csv")

print(df.shape)
print(df.columns.tolist())

df.info()

print(df.head())
print(df.tail())

print(df.dtypes)
print(df.nunique(dropna=False))
Do not trust inferred types blindly
A column containing IDs such as 00123 may be parsed as an
integer even though mathematical operations on the field make no sense.
A currency column may become text because a few rows contain commas,
symbols, or the word unknown.
| Column | Loaded type | Likely semantic type |
|---|---|---|
| customer_id | integer | identifier / string |
| purchase_date | object | datetime |
| revenue | object | numeric currency |
| is_active | object | boolean |
Storage type is not semantic type
A database integer can represent an identifier, category, quantity, year, or monetary amount. Statistical operations should follow the variable's meaning, not merely the dtype assigned by the software.
3. Find keys, duplicates, and suspicious repeated records
Duplicate records can distort counts, averages, class balance, and model evaluation. But not every repeated row is an error.
Check exact duplicates
duplicate_rows = df.duplicated().sum()

print("Exact duplicate rows:", duplicate_rows)
Check candidate keys
df["customer_id"].nunique()
len(df)

df["customer_id"].duplicated().sum()
If customer_id is supposed to identify one customer but the
same ID appears many times, determine whether:
- The dataset actually contains transactions rather than customers.
- The export joined tables incorrectly.
- The identifier was reused.
- Multiple historical states are present.
- Duplicate ingestion occurred.
Look for near-duplicates
Real-world duplicates are often not exact. One record may contain
ACME Ltd and another Acme LTD.. Addresses,
telephone numbers, and names may differ slightly while referring to the
same entity.
Do not automatically fuzzy-match and merge records during initial EDA. First estimate the scale of the problem and understand which attributes can legitimately differ.
4. Profile missing values instead of immediately filling them
Missing values are not one problem. A null can mean:
- Unknown.
- Not collected.
- Not applicable.
- Collection failed.
- User refused to answer.
- The field did not exist at the time.
- A join found no matching record.
Start with counts and percentages
missing = (
    df.isna()
      .mean()
      .mul(100)
      .sort_values(ascending=False)
)

print(missing)
Investigate missingness patterns
Ask whether missing values cluster by:
- Date.
- Country.
- Product version.
- Data source.
- Customer segment.
- Device type.
- Target outcome.
df.groupby("country")["income"].apply(
    lambda s: s.isna().mean()
).sort_values(ascending=False)
A field that is 20% missing overall may be 0% missing for one data source and 80% missing for another. That difference can reveal a pipeline or process issue.
Do not impute during diagnosis
Imputation changes the data. Understand why values are missing before deciding whether to fill, encode, model, exclude, or preserve the missingness explicitly.
5. Validate categories, ranges, dates, and units
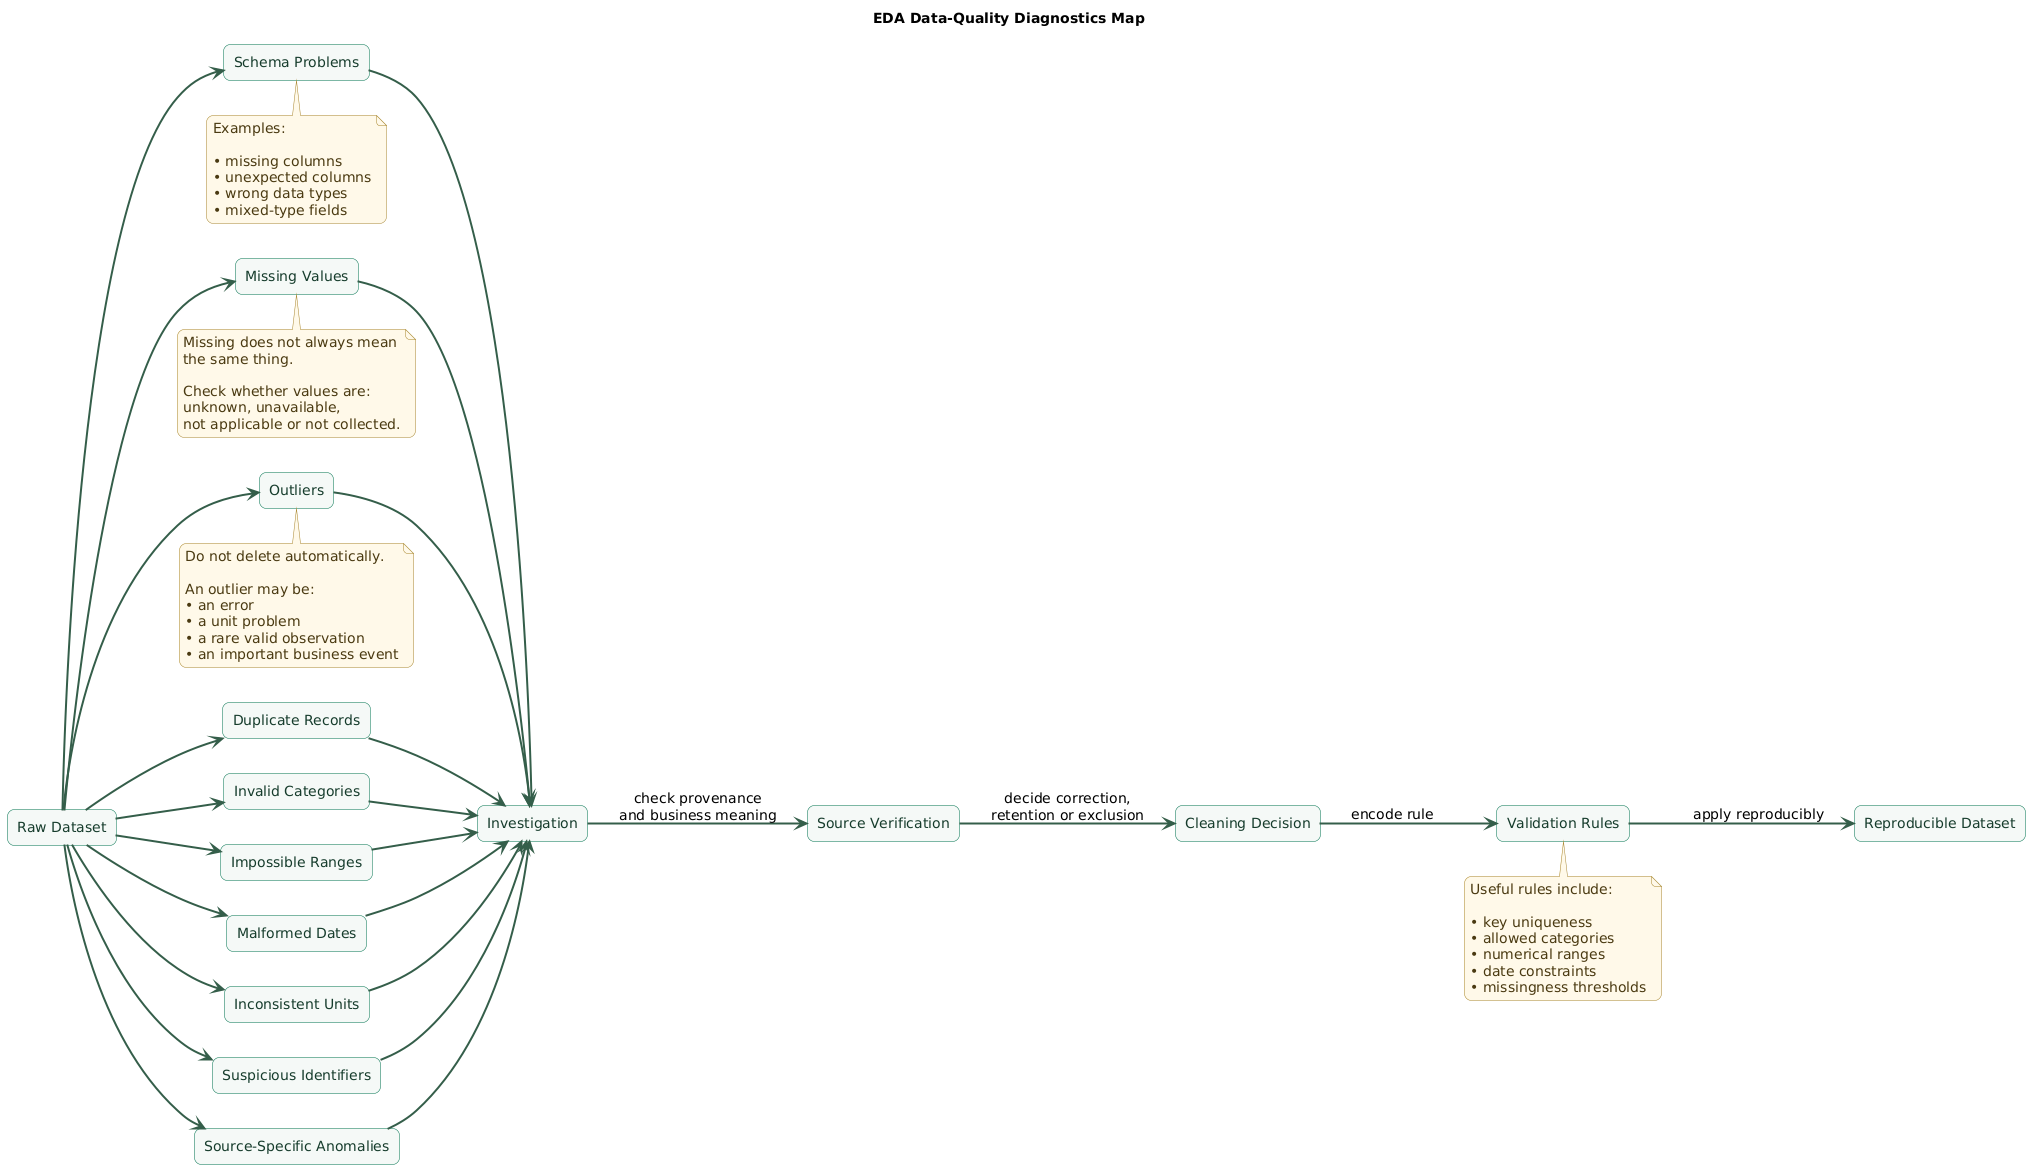
Data-quality diagnostics map (diagram)
Inspect categorical values
df["country"].value_counts(dropna=False)
df["status"].value_counts(dropna=False)
Common problems include:
United States
USA
U.S.A.
US
us
United States
These may represent the same category, but normalization should follow a defined mapping rather than an assumption hidden inside a notebook cell.
country_map = {
    "USA": "US",
    "U.S.A.": "US",
    "United States": "US",
    "us": "US"
}
Check numerical ranges
Examples of suspicious values:
- Age = -4.
- Discount = 180%.
- Quantity = 0 when every row should represent a completed purchase.
- Latitude = 900.
- Account balance = a text sentinel such as 999999.
df["age"].describe()

df.loc[
    (df["age"] < 0) | (df["age"] > 120),
    ["customer_id", "age"]
]
Validate dates
Dates deserve separate attention because parsing can succeed while the interpretation is wrong.
- Is
03/04/2026March 4 or April 3? - Are timestamps UTC or local time?
- Did daylight-saving transitions affect timestamps?
- Are future dates possible?
- Does the dataset contain impossible historical dates?
df["created_at"] = pd.to_datetime(
    df["created_at"],
    errors="coerce",
    utc=True
)

print(df["created_at"].min())
print(df["created_at"].max())
Check units explicitly
One column may contain centimeters and inches, kilograms and pounds, or dollars and euros without an obvious marker. Unit inconsistencies can appear statistically plausible and therefore survive basic validation.
Record units in the data dictionary and avoid converting values until you understand the original representation.
6. Inspect distributions and outliers
Once structural quality is understood, inspect each important variable independently.
For numerical variables, check
- Minimum and maximum.
- Median.
- Mean.
- Standard deviation.
- Quantiles.
- Skewness.
- Zero inflation.
- Extreme tails.
- Unexpected spikes.
df["revenue"].describe(
    percentiles=[0.01, 0.05, 0.25, 0.5, 0.75, 0.95, 0.99]
)
Use histograms and box plots deliberately
Histograms show shape. Box plots make large deviations visible. Log scales can make highly skewed distributions easier to inspect.
But do not assume a point outside a statistical threshold is an error.
An outlier can be
- A typo.
- A sensor failure.
- A unit mismatch.
- A genuinely large customer.
- A fraud event.
- A rare medical case.
- A seasonal peak.
- A new business segment.
Investigate provenance before deleting
The most extreme observations are often the records from which you learn the most about collection processes and business edge cases.
7. Explore relationships between variables
After univariate analysis, study how variables move together.
Numerical vs numerical
- Scatter plots.
- Correlation matrices.
- Rank correlations.
- Binned summaries.
Remember that correlation does not establish causation, and a low linear correlation does not prove that no relationship exists.
Categorical vs numerical
Compare distributions by group:
df.groupby("plan")["monthly_revenue"].agg(
    ["count", "mean", "median", "std"]
)
Categorical vs categorical
Cross-tabulations can reveal combinations that are rare, impossible, or strongly associated.
pd.crosstab(
    df["country"],
    df["subscription_status"],
    normalize="index"
)
Beware of aggregation effects
A relationship visible in the full dataset can disappear or reverse when data is split by region, age group, product, or acquisition channel.
Always ask whether an apparent pattern is explained by a hidden grouping variable.
8. Inspect the target, imbalance, and leakage
For supervised machine-learning projects, EDA must include the target variable and the process that creates it.
Class balance
df["churned"].value_counts()
df["churned"].value_counts(normalize=True)
A dataset containing 99.5% negative examples and 0.5% positive examples requires evaluation metrics and splitting decisions that reflect the imbalance.
Check label quality
- How is the label defined?
- Who assigns it?
- Can labels change later?
- How long after the event does the label become known?
- Are some groups labeled differently?
Look aggressively for leakage
Leakage occurs when the feature set contains information that would not be available when a real prediction is made or contains information derived from the target itself.
Examples:
- A churn model includes
account_closed_date. - A fraud model includes the final investigator decision.
- A hospital model includes a treatment given after diagnosis.
- A default model includes a collection-status field created after default.
Suspiciously good prediction is a debugging signal
If a simple feature predicts the target almost perfectly, do not immediately celebrate. Check timestamps, feature provenance, joins, and post-outcome information first.
9. Check segments, time periods, and drift
Aggregate statistics can hide major differences between groups.
Compare important metrics by
- Month or quarter.
- Country or region.
- Acquisition source.
- Product version.
- Device type.
- Customer segment.
- Data source.
Look for schema and behavior changes over time
A sudden shift may indicate:
- A product launch.
- A new tracking implementation.
- A changed business definition.
- A broken pipeline.
- A different source system.
- A genuine change in user behavior.
monthly = (
    df.assign(month=df["created_at"].dt.to_period("M"))
      .groupby("month")
      .agg(
          rows=("customer_id", "size"),
          revenue=("revenue", "mean")
      )
)

print(monthly)
Respect time during splitting
If the model predicts the future, random train-test splitting may give an unrealistically easy evaluation when the same users, entities, or temporal patterns appear on both sides.
Consider temporal splits, grouped splits, or entity-aware validation when they better match production use.
10. Turn discoveries into reproducible validation rules
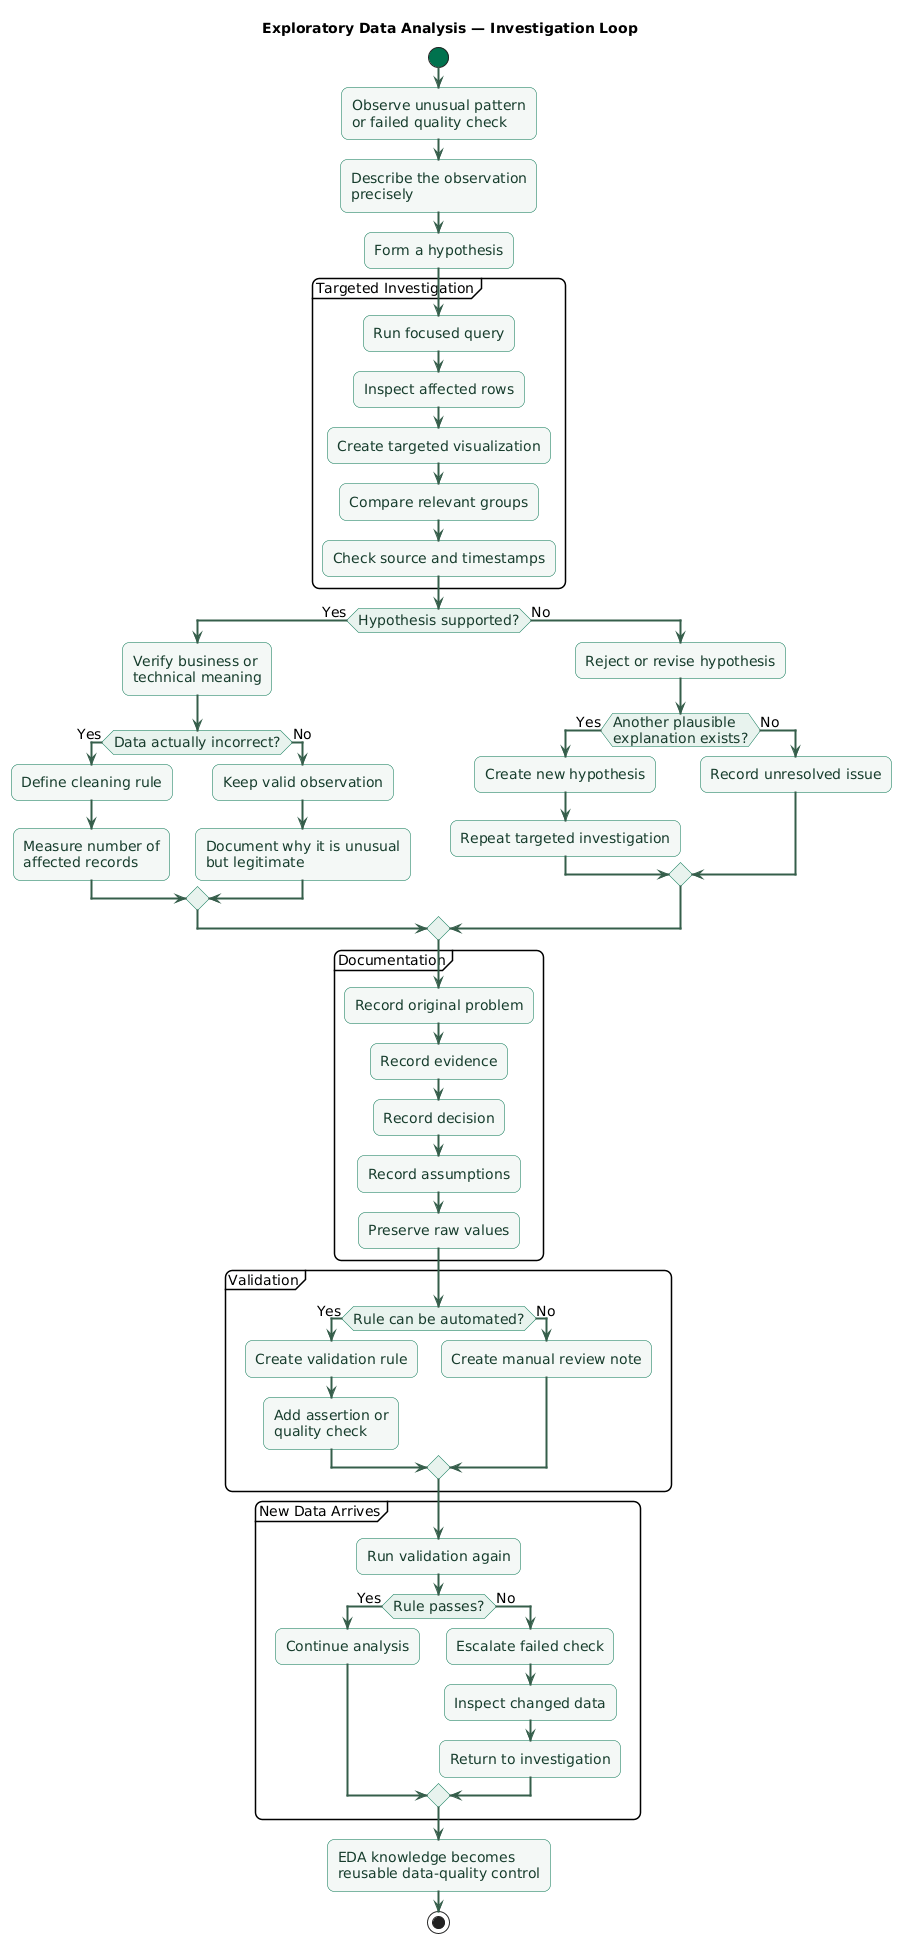
EDA is most valuable when discoveries become checks that can run again. Otherwise the same problem returns with the next data export.
EDA investigation loop (diagram)
Convert observations into assertions
Instead of writing:
"Age seems okay now."create a check:
assert df["age"].dropna().between(0, 120).all()Instead of:
"IDs looked unique."use:
assert df["customer_id"].is_uniqueBuild a data-quality summary
quality_report = {
    "rows": len(df),
    "columns": len(df.columns),
    "duplicate_rows": int(df.duplicated().sum()),
    "missing_customer_id": int(df["customer_id"].isna().sum()),
    "unique_customer_id": bool(df["customer_id"].is_unique),
    "min_date": str(df["created_at"].min()),
    "max_date": str(df["created_at"].max())
}

print(quality_report)
Document every non-obvious transformation
For each cleaning decision, record:
- The original problem.
- How many rows were affected.
- The rule used.
- The business or technical justification.
- Whether the original value remains recoverable.
EDA should reduce future uncertainty
The final output of good EDA is not only a notebook. It is a better data contract: expected columns, allowed categories, ranges, uniqueness requirements, missingness expectations, temporal constraints, and documented exceptions.
11. Copy/paste EDA checklist
Exploratory Data Analysis checklist for messy datasets

Understand the dataset
- Identify the data source.
- Record the extraction date.
- Record the dataset version if available.
- Define what one row represents.
- Define the intended analytical question.
- Preserve the raw dataset unchanged.
- Create reproducible transformations instead of editing raw files manually.

Shape and schema
- Check the number of rows.
- Check the number of columns.
- List all column names.
- Check for duplicate column names.
- Compare columns with the expected schema.
- Identify unexpected columns.
- Identify missing expected columns.
- Inspect a sample of raw rows.
- Inspect the first rows.
- Inspect the last rows.

Data types
- Review every column's storage type.
- Determine every important column's semantic type.
- Identify numeric values stored as strings.
- Identify identifiers incorrectly parsed as numbers.
- Identify booleans stored as text.
- Identify categorical codes stored as numeric values.
- Identify dates stored as strings.
- Identify mixed types within a column.

Keys and duplicates
- Identify candidate primary keys.
- Test key uniqueness.
- Count exact duplicate rows.
- Investigate duplicate identifiers.
- Determine whether repeated rows represent legitimate events.
- Look for duplicate ingestion.
- Look for join multiplication.
- Investigate likely near-duplicates where relevant.

Missing values
- Count missing values by column.
- Calculate missing percentages.
- Identify columns with very high missingness.
- Compare missingness across segments.
- Compare missingness over time.
- Compare missingness across source systems.
- Determine whether missing means unknown, unavailable, not applicable, or not collected.
- Avoid immediate imputation before understanding the pattern.
- Consider creating missingness indicators when analytically useful.

Categorical variables
- Count unique categories.
- Inspect category frequencies.
- Include null values in category counts.
- Look for whitespace differences.
- Look for capitalization differences.
- Look for spelling variations.
- Look for obsolete category codes.
- Look for unexpectedly rare categories.
- Map equivalent categories explicitly.
- Preserve the original category where auditing matters.

Numerical variables
- Inspect minimum and maximum.
- Inspect mean and median.
- Inspect standard deviation.
- Inspect quantiles.
- Check for impossible negative values.
- Check for impossible upper bounds.
- Check for sentinel values such as 999 or -1.
- Check for unexpected zero values.
- Check for extreme skew.
- Check for zero inflation.
- Investigate outliers before removing them.

Dates and time
- Parse dates explicitly.
- Record the expected date format.
- Check minimum date.
- Check maximum date.
- Look for impossible future dates.
- Look for unexpectedly old dates.
- Check timezone assumptions.
- Normalize timezones when appropriate.
- Check daylight-saving implications.
- Look for gaps or sudden volume changes over time.
- Check whether business events occurred before or after timestamps suggest.

Units and measurement
- Document the unit of every important numerical field.
- Check whether one column contains multiple units.
- Check currency consistency.
- Check decimal separators.
- Check percentage representation.
- Check whether values are stored as 0–1 or 0–100.
- Check measurement precision.
- Avoid conversions until the original unit is understood.

Univariate distributions
- Plot or summarize important numerical variables.
- Inspect histograms.
- Inspect box plots where useful.
- Inspect log-transformed views for highly skewed data.
- Review frequency tables for categorical variables.
- Look for multimodal distributions.
- Look for suspicious spikes.
- Look for truncation or clipping.
- Investigate extreme tails.

Relationships
- Inspect numerical correlations.
- Consider rank correlations for non-linear monotonic relationships.
- Plot important numerical pairs.
- Compare numerical distributions across categories.
- Build cross-tabulations for categorical pairs.
- Investigate unexpectedly strong relationships.
- Investigate contradictory combinations.
- Look for confounding segments.
- Avoid interpreting correlation as causation.

Target variable
- Confirm the target definition.
- Check target missingness.
- Check class balance.
- Inspect target by time.
- Inspect target by segment.
- Check for label noise.
- Understand when the label becomes available.
- Review whether the label can change later.

Leakage
- Review when every feature becomes available.
- Remove post-outcome information.
- Look for features derived directly from the target.
- Investigate near-perfect predictors.
- Review joins for future information.
- Review aggregate features for leakage across train and test data.
- Ensure preprocessing is fitted only on training data where appropriate.

Segments and drift
- Compare distributions by time period.
- Compare distributions by geography.
- Compare distributions by source system.
- Compare distributions by product version.
- Compare distributions by customer segment.
- Look for schema changes.
- Look for category changes.
- Look for sudden missingness changes.
- Look for abrupt volume changes.
- Determine whether changes reflect reality or pipeline problems.

Train-test strategy
- Decide whether random splitting matches production use.
- Use temporal splitting for forecasting or future prediction when appropriate.
- Use grouped splitting when the same entity appears multiple times.
- Prevent the same logical entity from leaking across train and test where necessary.
- Check whether distribution differences make evaluation unrealistic.

Documentation
- Record each discovered data-quality issue.
- Record how many rows are affected.
- Record the suspected cause.
- Record the cleaning decision.
- Record business assumptions.
- Record unresolved questions.
- Keep a data dictionary.
- Keep transformations in version-controlled code.

Validation rules
- Assert expected columns.
- Assert important data types.
- Assert key uniqueness.
- Assert allowed categories.
- Assert numerical ranges.
- Assert date ranges.
- Assert acceptable missingness.
- Assert required non-null fields.
- Assert relationship rules where appropriate.
- Run validation when new data arrives.

Final EDA review
- Confirm the dataset's unit of observation.
- Confirm key uniqueness assumptions.
- Confirm missing-value strategy.
- Confirm category normalization.
- Confirm outlier decisions.
- Confirm date and timezone handling.
- Confirm unit conversions.
- Confirm target definition.
- Confirm leakage checks.
- Confirm train-test strategy.
- Confirm unresolved risks are documented.
- Re-run the complete workflow from raw data.
12. FAQ
What should I check first during EDA?
Start with structure: dataset shape, column names, types, candidate keys, duplicate rows, missing values, cardinality, and a sample of raw records. Structural problems can invalidate later statistical analysis, so inspect them before building complicated charts.
Should I remove all outliers?
No. An outlier can be an error, but it can also be a legitimate rare observation or the most important case in the dataset. Investigate its source and context before deciding whether to retain, correct, transform, cap, or exclude it.
Should missing values always be imputed?
No. First determine what missing values mean and whether they occur systematically. Missingness itself may carry information or reveal a problem in data collection.
How do I detect target leakage?
Ask when each feature becomes available relative to the moment a prediction would be made. Investigate variables created after the outcome, fields derived from the label, suspiciously strong predictors, and joins that may introduce future information.
Should I modify the raw dataset directly?
Prefer not to. Preserve the raw input and express cleaning as reproducible transformations. This makes the analysis auditable and lets you rerun the same process when the source changes.
How much visualization is enough for EDA?
Enough to answer the questions raised by the data. A useful EDA process combines tables, validation checks, targeted plots, and source investigation. More charts do not automatically mean better analysis.
Key terms (quick glossary)
- Exploratory Data Analysis (EDA)
- The process of inspecting, summarizing, visualizing, and questioning a dataset to understand its structure, quality, patterns, assumptions, and limitations before formal modeling.
- Unit of observation
- The real-world entity or event represented by one row of a dataset, such as one customer, transaction, device reading, or visit.
- Cardinality
- The number of distinct values present in a variable.
- Missingness
- The pattern and mechanism by which values are absent from a dataset.
- Duplicate
- A repeated record or entity that may be legitimate or may result from ingestion, joining, or data-entry problems.
- Outlier
- An observation that differs substantially from most other observations according to statistical, business, or contextual criteria.
- Data leakage
- Information entering a model or evaluation process that would not be legitimately available when the model is used in production.
- Target leakage
- A form of leakage in which features directly or indirectly reveal the outcome the model is intended to predict.
- Data drift
- A change in the distribution, composition, or relationships of data over time or between environments.
- Schema
- The expected structure of a dataset, including columns, names, data types, constraints, and relationships.
- Data validation
- Automated or manual checks that confirm whether data satisfies defined structural and semantic expectations.
- Data provenance
- Information about where data came from, how it was collected, and which transformations or systems affected it.
Worth reading
Recommended guides from the category.