
Many analytics projects begin with a CSV export and a question such as: “Can we get this into a dashboard every morning?”
The first version often works like this: open the file in pandas, clean a few columns, calculate some totals, and draw charts. That is perfectly reasonable for exploration.
The problems begin when the file arrives again tomorrow, column names change, one date fails to parse, someone edits the dashboard formula, and two different charts start using different definitions of the same metric.
A lightweight analytics pipeline solves those problems without requiring a full warehouse, orchestration platform, or distributed processing system. The goal is simply to make the path from raw file to displayed metric explicit and reproducible.
Keep the architecture proportional
A pipeline does not need ten services to be a pipeline. One Python project with clear raw, validated, transformed, query, and presentation boundaries can be substantially more reliable than a larger stack whose responsibilities are unclear.
1. Keep the pipeline simple, but separate its stages
Lightweight CSV-to-dashboard architecture (diagram)

A useful small architecture has six logical stages:
raw CSV
   ↓
validation
   ↓
clean transformation
   ↓
analytical storage
   ↓
metrics / queries
   ↓
dashboard
They can all live in one repository and run on one machine. The separation matters because each stage has a different responsibility.
Raw layer
Preserve the source file exactly as received. This gives you evidence when a pipeline suddenly produces different results.
Validation layer
Decide whether the file is structurally safe enough to process.
Transformation layer
Normalize types, category names, timestamps, keys, derived columns, and business rules.
Analytical layer
Store cleaned data in a format optimized for repeated analytical reads.
Metric layer
Define reusable business calculations once rather than rebuilding them in each chart.
Presentation layer
Filter and visualize already validated analytical data.
2. Treat CSV files as raw inputs
CSV is intentionally simple. It stores text rows, but it does not provide the same strong schema guarantees as a database table or typed analytical format.
Basic pandas ingestion
from pathlib import Path
import pandas as pd

source = Path(
    "data/raw/orders_2026-08-21.csv"
)

df = pd.read_csv(source)

print(df.shape)
print(df.dtypes)
That is enough for exploration, but recurring ingestion should make assumptions more explicit.
Specify columns when possible
columns = [
    "order_id",
    "customer_id",
    "created_at",
    "country",
    "status",
    "revenue"
]

df = pd.read_csv(
    source,
    usecols=columns
)
Loading only required columns reduces unnecessary parsing and also makes your dependency on the source schema visible.
Be explicit about important types
df = pd.read_csv(
    source,
    usecols=columns,
    dtype={
        "order_id": "string",
        "customer_id": "string",
        "country": "string",
        "status": "string"
    }
)

df["created_at"] = pd.to_datetime(
    df["created_at"],
    utc=True,
    errors="coerce"
)

df["revenue"] = pd.to_numeric(
    df["revenue"],
    errors="coerce"
)
Do not silently overwrite raw files
A simple structure might be:
data/
├── raw/
│   ├── orders_2026-08-20.csv
│   └── orders_2026-08-21.csv
├── processed/
│   └── orders.parquet
└── metrics/
    └── daily_metrics.parquet
If a later transformation is wrong, you can rebuild from the original input.
Large CSV files can be processed in chunks
for chunk in pd.read_csv(
    source,
    chunksize=100_000
):
    process(chunk)
Chunking is useful when the file is larger than you comfortably want to load into one pandas DataFrame. It does not automatically make every transformation easy, because some global operations still need state across chunks.
3. Validate before you calculate
CSV data-quality validation flow (diagram)
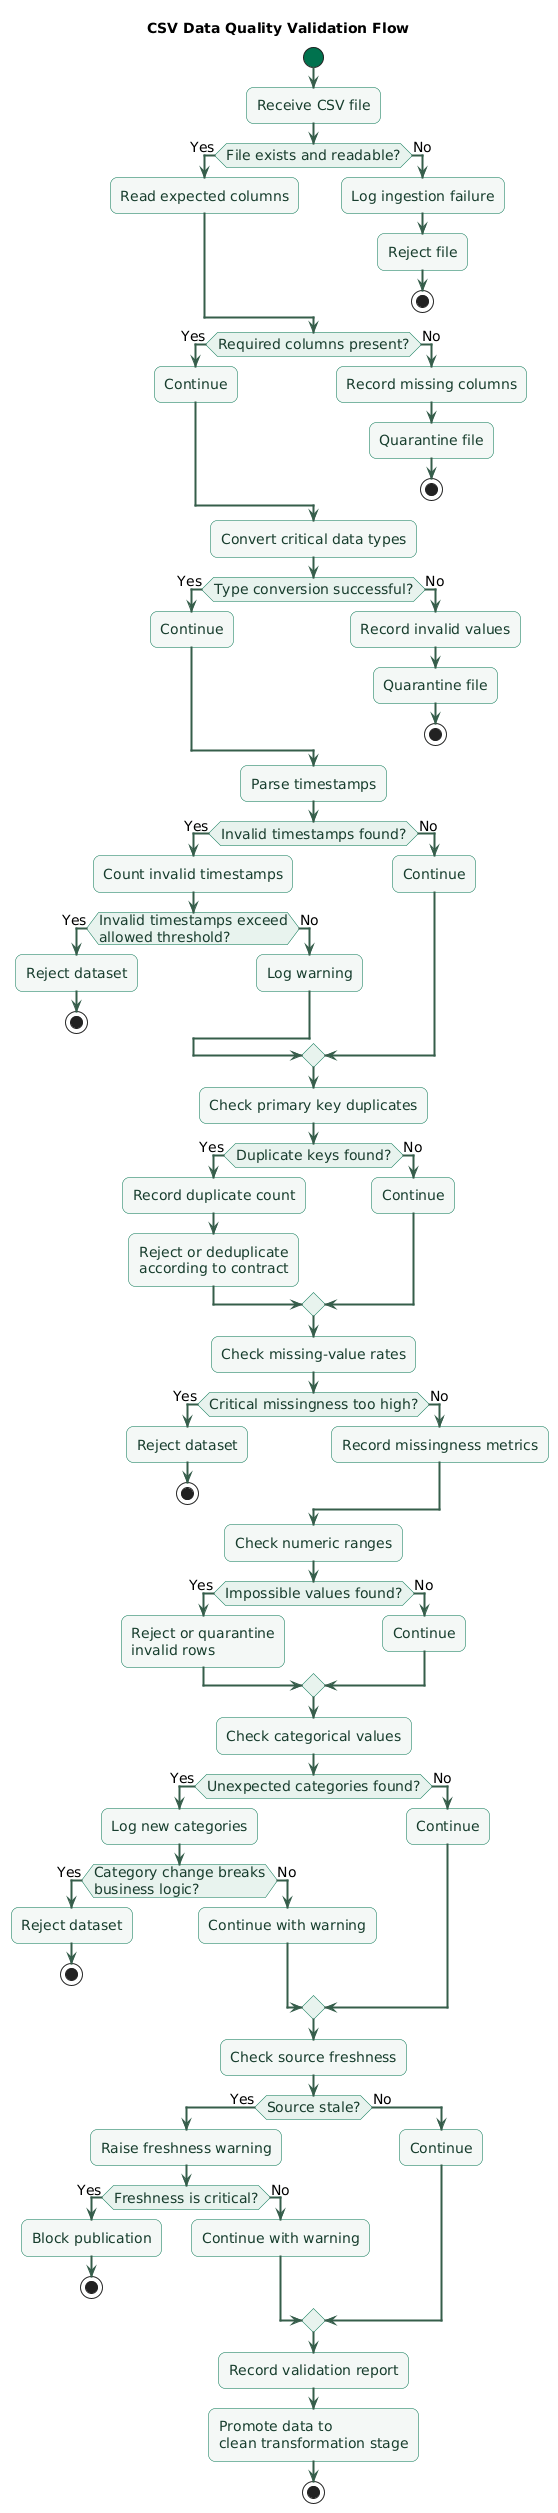
The most dangerous dashboard is not one that crashes. It is one that successfully displays incorrect numbers.
Check required columns
required_columns = {
    "order_id",
    "customer_id",
    "created_at",
    "status",
    "revenue"
}

missing_columns = (
    required_columns - set(df.columns)
)

if missing_columns:
    raise ValueError(
        f"Missing columns: {missing_columns}"
    )
Check unique identifiers
duplicate_orders = (
    df["order_id"].duplicated().sum()
)

if duplicate_orders:
    raise ValueError(
        f"Duplicate order IDs: "
        f"{duplicate_orders}"
    )
Check failed date parsing
invalid_dates = (
    df["created_at"].isna().sum()
)

if invalid_dates:
    raise ValueError(
        f"Invalid timestamps: "
        f"{invalid_dates}"
    )
Check impossible values
negative_revenue = (
    df["revenue"] < 0
).sum()

if negative_revenue:
    raise ValueError(
        f"Negative revenue rows: "
        f"{negative_revenue}"
    )
Whether negative revenue is truly invalid depends on the domain. Refunds may legitimately be negative. Validation rules should encode business meaning rather than generic assumptions.
Validate categories
expected_statuses = {
    "paid",
    "pending",
    "cancelled",
    "refunded"
}

unexpected = (
    set(df["status"].dropna().unique())
    - expected_statuses
)

if unexpected:
    raise ValueError(
        f"Unexpected statuses: {unexpected}"
    )
Hard failures vs warnings
Not every anomaly should stop the pipeline.
| Check | Possible response |
|---|---|
| Missing required column | Stop pipeline |
| Duplicate primary key | Usually stop pipeline |
| Unknown optional category | Warn and inspect |
| Missing rate increased slightly | Warn and monitor |
| Source file is stale | Warn or block publication |
Fail before the dashboard
When a structural error makes metrics untrustworthy, failing the refresh is preferable to publishing a polished chart built from corrupted data.
4. Build reusable cleaning transformations
Move transformation logic out of interactive notebooks and dashboard callbacks into ordinary Python functions.
import pandas as pd

def clean_orders(df):
    out = df.copy()

    out["country"] = (
        out["country"]
        .str.strip()
        .str.upper()
    )

    out["status"] = (
        out["status"]
        .str.strip()
        .str.lower()
    )

    out["created_at"] = pd.to_datetime(
        out["created_at"],
        utc=True,
        errors="raise"
    )

    out["revenue"] = pd.to_numeric(
        out["revenue"],
        errors="raise"
    )

    out["order_date"] = (
        out["created_at"].dt.date
    )

    return out
Keep transformations deterministic
Running the same transformation on the same input should produce the same result.
Avoid hidden dependencies on:
- The current notebook state.
- Manually edited global variables.
- An undocumented local file.
- The current date when historical reproducibility matters.
Separate cleaning from business metrics
Normalizing a country code belongs in the data-cleaning layer.
Calculating monthly active customers belongs in the metric layer.
Mixing both into one giant function makes testing and reuse harder.
Test representative edge cases
def test_clean_orders():
    source = pd.DataFrame({
        "country": [" be "],
        "status": ["PAID"],
        "created_at": [
            "2026-08-21T10:30:00Z"
        ],
        "revenue": ["19.99"]
    })

    result = clean_orders(source)

    assert result.loc[0, "country"] == "BE"
    assert result.loc[0, "status"] == "paid"
    assert result.loc[0, "revenue"] == 19.99
5. Convert repeated CSV reads to Parquet
CSV is excellent for interoperability but inefficient as the repeated analytical storage layer.
Every dashboard refresh may otherwise need to:
- Open text files.
- Parse delimiters.
- Infer or apply types.
- Parse dates.
- Repeat cleaning.
Write validated data to Parquet
clean = clean_orders(df)

clean.to_parquet(
    "data/processed/orders.parquet",
    index=False
)
Read it later
orders = pd.read_parquet(
    "data/processed/orders.parquet"
)
Why this helps
- Column types are preserved more reliably.
- Analytical reads can avoid unused columns.
- Storage is column-oriented.
- Repeated parsing of CSV text is avoided.
- DuckDB and other analytical tools can query it directly.
Keep the original CSV anyway
Parquet is the prepared analytical layer, not necessarily a replacement for preserving the source artifact.
raw/orders_2026-08-21.csv
        ↓
validated transformation
        ↓
processed/orders.parquet
6. Add DuckDB when analytics become query-shaped
pandas is excellent for data manipulation, but analytics often becomes easier to express as SQL once you need repeated filters, groups, joins, and aggregates.
Query Parquet directly
import duckdb

query = """
SELECT
    country,
    COUNT(*) AS orders,
    SUM(revenue) AS revenue
FROM read_parquet(
    'data/processed/orders.parquet'
)
WHERE status = 'paid'
GROUP BY country
ORDER BY revenue DESC
"""

result = duckdb.sql(query).df()

print(result)
You can also query CSV directly
result = duckdb.sql("""
SELECT
    status,
    COUNT(*) AS rows
FROM read_csv(
    'data/raw/orders_2026-08-21.csv'
)
GROUP BY status
""").df()
Direct CSV queries are useful for exploration or ingestion, but a validated Parquet layer still gives the pipeline a cleaner contract.
Why a serverless analytical database helps
You gain SQL without needing to deploy and maintain a separate database server.
This is useful for:
- Local dashboards.
- Internal analytics tools.
- Prototype data products.
- Scheduled reports.
- Moderate local analytical datasets.
Use SQL for analytical intent
SELECT
    DATE_TRUNC(
        'month',
        created_at
    ) AS month,
    COUNT(DISTINCT customer_id)
        AS active_customers,
    SUM(revenue)
        AS paid_revenue
FROM orders
WHERE status = 'paid'
GROUP BY 1
ORDER BY 1
A named query like this can become the canonical implementation of a dashboard metric.
7. Create a reusable metric layer
Dashboards become inconsistent when every chart independently implements business definitions.
Define metrics once
For example:
Paid revenue:
SUM(revenue)
WHERE status = 'paid'

Active customers:
COUNT(DISTINCT customer_id)
WHERE status = 'paid'

Average order value:
paid revenue / paid orders
Materialize commonly reused aggregates
daily_metrics = duckdb.sql("""
SELECT
    CAST(created_at AS DATE)
        AS metric_date,

    COUNT(*) FILTER (
        WHERE status = 'paid'
    ) AS paid_orders,

    SUM(revenue) FILTER (
        WHERE status = 'paid'
    ) AS paid_revenue,

    COUNT(DISTINCT customer_id)
        FILTER (
            WHERE status = 'paid'
        ) AS active_customers

FROM read_parquet(
    'data/processed/orders.parquet'
)

GROUP BY 1
ORDER BY 1
""").df()

daily_metrics.to_parquet(
    "data/metrics/daily_metrics.parquet",
    index=False
)
Why materialize metrics?
If every dashboard interaction scans millions of transactional rows merely to redraw the same daily revenue chart, the dashboard is doing pipeline work.
A small prepared table can be much faster and easier to validate.
Keep metric definitions versioned
If “revenue” changes from including refunds to excluding them, that is a data-contract change.
Put metric SQL or Python in source control rather than editing formulas directly inside the visualization layer.
8. Keep the dashboard thin
The dashboard should mainly:
- Load prepared data.
- Apply user-selected filters.
- Calculate lightweight presentation summaries.
- Render tables and charts.
It should not need to repair malformed CSV files on every button click.
Minimal Streamlit example
import pandas as pd
import streamlit as st

@st.cache_data
def load_metrics():
    return pd.read_parquet(
        "data/metrics/daily_metrics.parquet"
    )

metrics = load_metrics()

st.title("Sales Dashboard")

st.metric(
    "Paid revenue",
    f"${metrics['paid_revenue'].sum():,.0f}"
)

st.line_chart(
    metrics,
    x="metric_date",
    y="paid_revenue"
)
Streamlit reruns application code when users interact with the app, so caching data-loading or expensive query results can prevent unnecessary repeated work.
Use cache boundaries intentionally
@st.cache_data(
    ttl=900
)
def load_dashboard_data():
    return duckdb.sql("""
        SELECT *
        FROM read_parquet(
            'data/metrics/daily_metrics.parquet'
        )
    """).df()
A time-to-live can be useful when source data is refreshed on a known cadence.
Do not cache sensitive or untrusted objects carelessly
Understand the framework's caching semantics, data sharing behavior, serialization mechanism, and invalidation rules before using caching for sensitive workloads.
9. Automate refreshes and freshness checks
Lightweight analytics refresh flow (diagram)
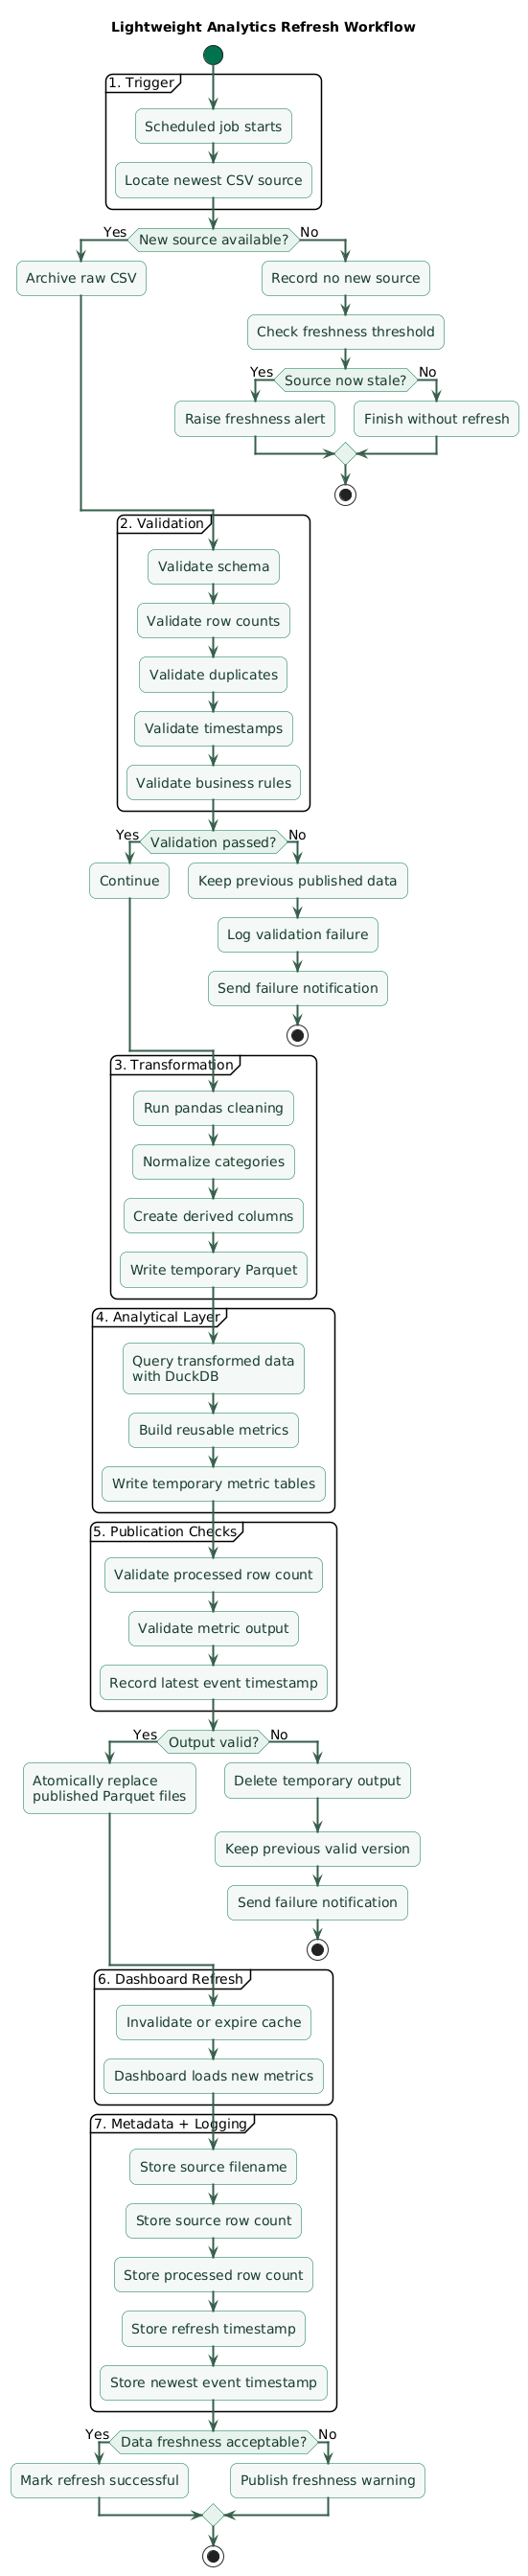
A dashboard becomes a real data product when its refresh is repeatable.
Pipeline entry point
def run_pipeline(source_path):
    raw = load_csv(source_path)

    validate_schema(raw)
    validate_quality(raw)

    clean = clean_orders(raw)

    write_processed(clean)

    metrics = build_metrics(clean)

    write_metrics(metrics)
Keep one executable command
python -m pipeline.refresh \
    data/raw/orders_2026-08-21.csv
That command can later be triggered manually, by cron, Task Scheduler, a CI runner, or a workflow scheduler.
Write new output atomically
Do not overwrite the dashboard's current data file halfway through a refresh.
A safer pattern is:
write:
daily_metrics.tmp.parquet

validate output

rename:
daily_metrics.tmp.parquet
        ↓
daily_metrics.parquet
The dashboard either sees the previous valid dataset or the new valid dataset, not a partially written file.
Store freshness metadata
{
    "source_file": "orders_2026-08-21.csv",
    "source_rows": 48231,
    "processed_rows": 48231,
    "pipeline_finished_at": "2026-08-21T06:15:12Z",
    "max_event_time": "2026-08-21T05:59:41Z"
}
Displaying “last refreshed” is useful, but monitoring the newest event timestamp is often even better because a pipeline can run successfully on stale input.
Log row counts through the pipeline
raw rows:         48,231
after validation: 48,231
after dedupe:     48,210
paid rows:        39,482
Sudden differences make debugging much faster.
Incremental refresh
Rebuilding everything is often the best first implementation because it is simple and deterministic.
Incremental processing becomes useful when historical volume makes full refreshes unnecessarily expensive.
A common strategy is to partition data:
processed/
├── year=2026/
│   ├── month=07/
│   └── month=08/
└── year=2025/
But incremental pipelines introduce additional problems such as late arrivals, corrections, duplicate ingestion, and idempotency. Do not add that complexity until the simpler full rebuild is actually a bottleneck.
10. Know when the lightweight stack has reached its limit
pandas, Parquet, DuckDB, and a lightweight dashboard can cover a surprising amount of analytics work.
The right moment to migrate is not when the project starts looking “professional.” It is when concrete requirements exceed the current architecture.
Signals you may need a larger platform
- Many independent data sources.
- Frequent concurrent writers.
- Large numbers of dashboard users.
- Strict row-level access controls.
- Complex transformation dependencies.
- Near-real-time update requirements.
- Long-running jobs that need retries and orchestration.
- Several teams modifying shared data models.
- Local storage is no longer operationally reliable.
Good boundaries make migration easier
If the project already separates:
ingestion
validation
clean data
metric definitions
presentation
you can replace individual components without redesigning everything.
For example:
CSV folder
    ↓
object storage

local Parquet
    ↓
warehouse tables

cron script
    ↓
workflow orchestrator

local dashboard
    ↓
hosted BI / application layer
The conceptual pipeline stays recognizable.
Scale architecture in response to pain
Start with the simplest system that preserves reproducibility, quality, metric consistency, and recoverability. Add infrastructure when a measured requirement justifies it.
11. Copy/paste CSV-to-dashboard checklist
CSV-to-dashboard analytics pipeline checklist

Architecture
- Separate raw ingestion from dashboard rendering.
- Define a validation stage.
- Define a transformation stage.
- Define an analytical storage layer.
- Define reusable metric logic.
- Keep presentation separate from data cleaning.
- Keep the first architecture intentionally small.

Raw files
- Preserve incoming source files.
- Add a source date or unique filename.
- Do not overwrite raw files silently.
- Record source file size.
- Record source modification time.
- Record source row count.
- Consider checksums when duplicate delivery is possible.

CSV ingestion
- Define expected delimiter.
- Define expected encoding.
- Define required columns.
- Use usecols when only part of the source is needed.
- Define critical string columns explicitly.
- Parse timestamps deliberately.
- Convert numeric fields deliberately.
- Handle bad rows intentionally.
- Use chunking when files are too large for comfortable memory use.

Schema validation
- Check all required columns.
- Detect unexpected duplicate column names.
- Validate identifier columns.
- Validate expected data types.
- Detect failed timestamp parsing.
- Detect failed numeric parsing.
- Check required non-null fields.
- Stop on structural errors that invalidate metrics.

Data quality
- Check duplicate primary keys.
- Check missing-value rates.
- Check impossible numeric ranges.
- Check unexpected categories.
- Check stale input.
- Check minimum expected row counts.
- Check suspicious row-count spikes.
- Check suspicious row-count drops.
- Separate hard failures from warnings.
- Log validation results.

Cleaning
- Put transformations in reusable functions.
- Normalize string whitespace.
- Normalize known category aliases.
- Normalize timestamps and timezone assumptions.
- Standardize identifiers.
- Create derived columns deterministically.
- Keep cleaning separate from metric calculation.
- Add unit tests for critical transformations.
- Avoid notebook-only transformation logic.

Processed storage
- Preserve the raw CSV separately.
- Write cleaned data to Parquet where useful.
- Preserve useful data types.
- Use stable processed filenames or partitions.
- Avoid partially written output files.
- Validate output before publication.
- Consider partitioning only when volume requires it.

DuckDB
- Use SQL when filters and aggregates become easier to express as queries.
- Query Parquet directly where useful.
- Query CSV directly for exploration or ingestion when appropriate.
- Keep important metric SQL version-controlled.
- Avoid embedding inconsistent SQL copies in multiple dashboard pages.
- Parameterize filters safely.
- Profile expensive queries before adding infrastructure.

Metrics
- Define canonical metric names.
- Define metric numerator and denominator.
- Define inclusion and exclusion rules.
- Define time grain.
- Define timezone.
- Define refund and cancellation treatment.
- Define active-user logic.
- Define revenue logic.
- Version metric definitions.
- Materialize commonly reused aggregates when useful.
- Test metric calculations on known examples.

Dashboard
- Read prepared analytical data.
- Keep heavy transformations outside normal UI reruns.
- Cache expensive data-loading or query functions where appropriate.
- Set cache invalidation deliberately.
- Display data freshness.
- Handle empty datasets.
- Handle missing categories.
- Handle date-filter boundaries.
- Keep chart calculations consistent with canonical metrics.
- Do not hide pipeline errors behind empty charts.

Caching
- Cache serializable data computations where appropriate.
- Cache database connections or global resources separately when appropriate.
- Understand whether cached objects are shared across users.
- Set TTL where freshness requires it.
- Clear or invalidate cache after data publication where necessary.
- Do not cache sensitive data without understanding storage semantics.
- Treat untrusted serialized data carefully.

Refresh process
- Create one reproducible pipeline command.
- Make full refresh idempotent where possible.
- Validate before publishing.
- Write temporary output first.
- Atomically replace published output.
- Record refresh start time.
- Record refresh end time.
- Record source filename.
- Record processed row count.
- Record latest event timestamp.
- Log failures.

Freshness
- Track when the pipeline last ran.
- Track the newest source event timestamp.
- Alert when the source is unexpectedly old.
- Distinguish pipeline freshness from source freshness.
- Show dashboard users when data was last updated.
- Define an acceptable freshness threshold.

Observability
- Log row counts at every major stage.
- Log duplicate counts.
- Log invalid-row counts.
- Log category changes.
- Log missing-value rates.
- Log output paths.
- Preserve exception details.
- Keep historical pipeline logs.
- Make silent failure impossible.

Incremental processing
- Start with full rebuilds when practical.
- Add incremental processing only when needed.
- Define an incremental key.
- Handle late-arriving rows.
- Handle corrected historical rows.
- Prevent duplicate ingestion.
- Make reruns idempotent.
- Consider partitions by date.
- Rebuild recent partitions when late data is common.

Repository
- Keep pipeline code in source control.
- Keep dashboard code in source control.
- Keep metric definitions in source control.
- Keep tests in source control.
- Do not commit sensitive production data.
- Add example or synthetic input for tests.
- Document local setup.
- Document the refresh command.

Suggested structure
- pipeline/io.py
- pipeline/validation.py
- pipeline/cleaning.py
- pipeline/metrics.py
- pipeline/refresh.py
- dashboard/app.py
- tests/test_validation.py
- tests/test_cleaning.py
- tests/test_metrics.py
- data/raw/
- data/processed/
- data/metrics/

Security
- Do not expose sensitive raw CSV files through the dashboard.
- Restrict filesystem access appropriately.
- Do not hard-code credentials.
- Validate uploaded filenames if uploads are accepted.
- Treat user-provided CSV as untrusted input.
- Avoid executing content from source files.
- Limit access to dashboards containing private information.
- Define retention for raw exports.

Performance
- Load only required columns.
- Avoid reparsing raw CSV on every dashboard interaction.
- Use Parquet for repeated analytical reads.
- Pre-aggregate common dashboard metrics.
- Cache expensive reads.
- Use DuckDB for query-heavy local analytics.
- Measure before optimizing.
- Avoid distributed systems when one machine is sufficient.

Scaling decision
- Measure dataset growth.
- Measure dashboard concurrency.
- Measure refresh duration.
- Measure query latency.
- Count source systems.
- Count dependent transformations.
- Evaluate access-control requirements.
- Evaluate availability requirements.
- Evaluate collaboration requirements.
- Migrate only when concrete limitations justify it.

Final review
- Can the entire dashboard be rebuilt from raw data?
- Can a malformed source file be detected before publication?
- Are metric definitions centralized?
- Is source freshness visible?
- Can a failed refresh leave the previous valid dashboard data intact?
- Can you explain where every displayed number comes from?
- Can the current architecture be replaced component by component later?
12. FAQ
Is CSV good enough for a small analytics pipeline?
Yes. CSV can remain the incoming interchange format. The important step is to stop treating every new file as an ad-hoc analysis and instead validate, transform, and publish it through a repeatable pipeline.
Why convert CSV to Parquet?
CSV stores text and requires repeated parsing and type reconstruction. Parquet is a typed column-oriented analytical format and is often better suited to repeated reads, column selection, compression, and analytical query engines.
Why use DuckDB instead of only pandas?
You do not have to. pandas is enough for many small workflows. DuckDB becomes useful when analytical logic naturally looks like SQL: aggregations, filters, joins, window calculations, and direct queries over multiple files.
Should the dashboard load the raw CSV directly?
For prototypes, that can be acceptable. For recurring analytics, it is safer to let a pipeline validate and prepare the data first, then have the dashboard read the resulting analytical tables or metric datasets.
How often should the dashboard refresh?
Match refresh frequency to the business need and source availability. There is little value in rebuilding a dashboard every minute when its source CSV arrives once each morning.
When is this architecture too small?
Consider moving beyond local files and lightweight scripts when concurrency, data volume, update frequency, source count, security, reliability, or transformation dependency management creates recurring operational problems.
Key terms (quick glossary)
- Analytics pipeline
- A repeatable sequence that moves data from raw input through validation, transformation, analytical modeling, and presentation.
- CSV
- A plain-text delimited file format commonly used to exchange tabular data.
- Parquet
- A typed columnar storage format designed for efficient analytical data access.
- DuckDB
- An analytical SQL database engine that can run embedded in an application and query files such as CSV and Parquet directly.
- Data validation
- Automated checks that verify structural and business assumptions before data is used downstream.
- Schema
- The expected structure of a dataset, including columns, names, types, and sometimes additional constraints.
- Metric layer
- A reusable set of definitions and transformations that produce canonical business measures for downstream reports and dashboards.
- Data freshness
- A measure of how recently the source and analytical datasets were updated relative to their expected schedule.
- Cache
- Stored results of previous computations or queries that can be reused to avoid repeating expensive work.
- Idempotent pipeline
- A pipeline designed so that rerunning the same processing operation does not incorrectly duplicate or corrupt its output.
- Incremental processing
- Updating only new or changed portions of a dataset instead of rebuilding the complete analytical dataset each time.
- Atomic publication
- Replacing a published analytical output only after the complete new output has been successfully created and validated.
Worth reading
Recommended guides from the category.