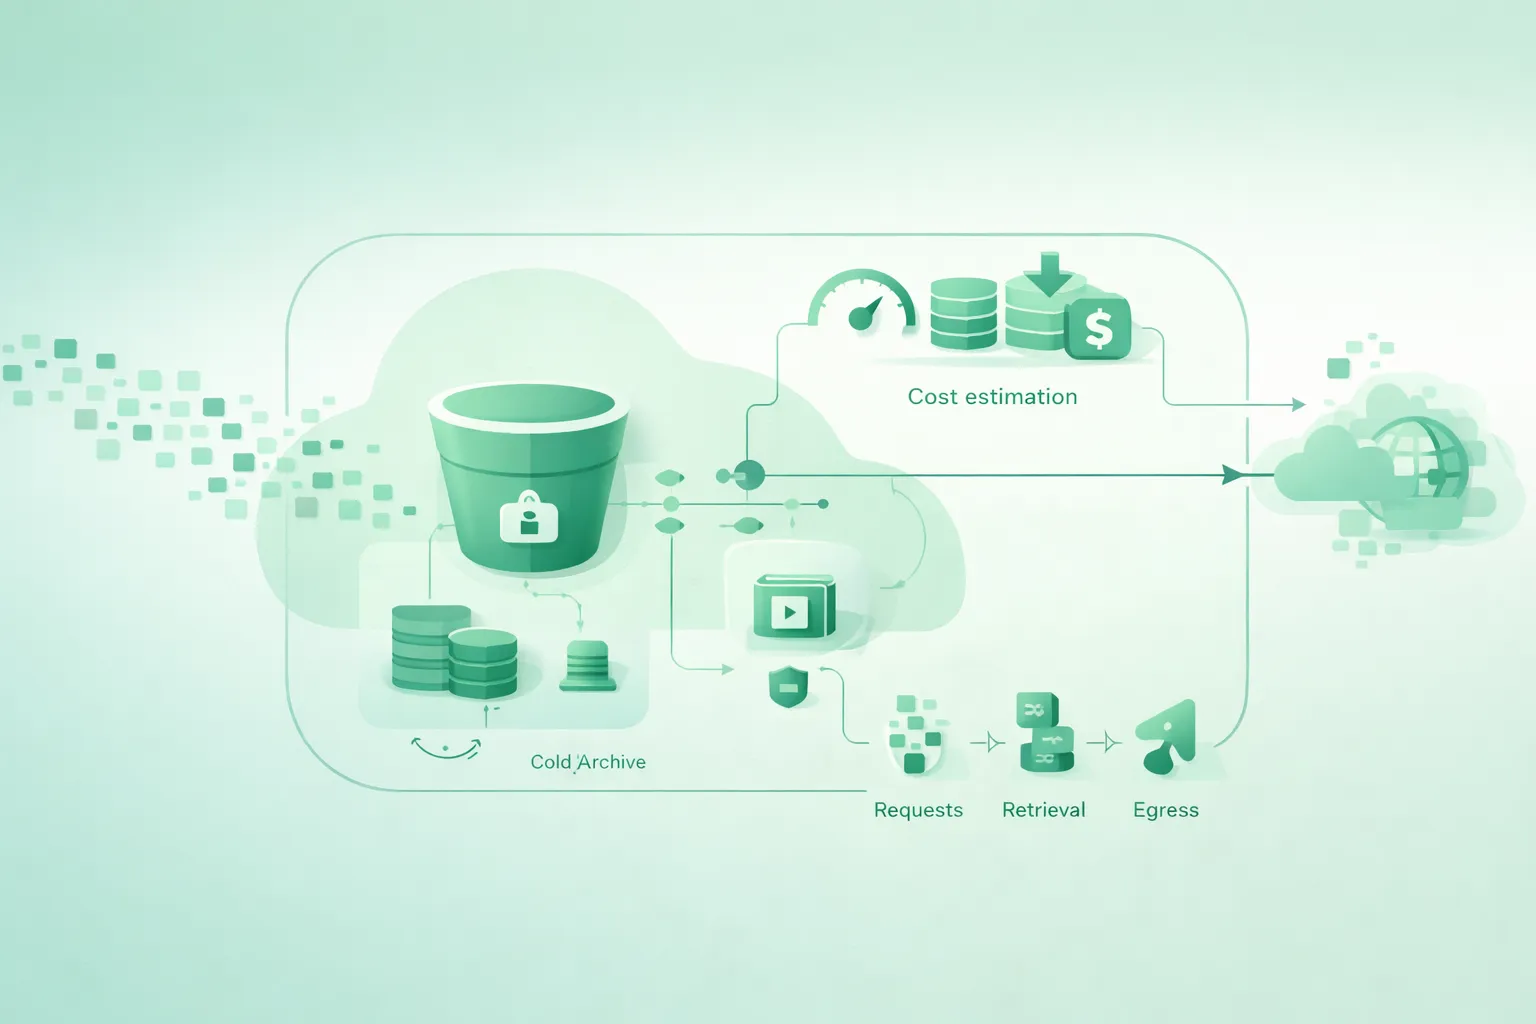
Estimating cloud storage cost is easy if you only think in $ per GB-month. It becomes accurate when you include the other three drivers that show up on real invoices: request charges, retrieval fees (for cold tiers), and egress. These “extras” are the difference between a predictable bill and a surprise.
This guide focuses on object storage pricing across cloud providers. The names differ, but the accounting model is similar: you pay for how much you store, how often you touch it, how you retrieve it, and where the bytes go.
Outcome you want
A usable estimate is not a single number. It is a cost model you can update as traffic changes: storage size, request counts by type, retrieval volume, and egress volume by destination.
1. Why storage bills surprise teams
Most teams forecast storage like this: “We will store ~5 TB, so the bill will be roughly 5 TB × $/GB-month.” That approach fails in any of these common situations:
- High request volume: millions of GETs or PUTs, especially for small objects.
- Cold storage access: low storage price, but you pay for retrieval (and sometimes restore operations).
- External delivery: serving files to users creates egress.
- Cross-region patterns: replication, multi-region apps, or analytics in another region.
- Lots of metadata ops: LIST, HEAD, multipart uploads, retries, background jobs.
Example: the “cheap storage, expensive app” trap
Your storage class looks cheap on paper, but your workload reads a large fraction of the data every day. The bill ends up dominated by retrieval and egress rather than GB-month. In practice, you needed a “hot” tier or caching/CDN in front of the bucket.
2. The four cost components (with formulas)
A good estimate is just four sums. Everything else is detail and edge cases.
Cloud storage cost model (diagram)
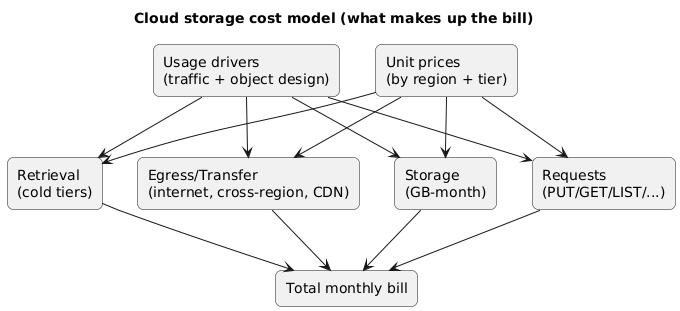
| Component | What you pay for | Typical unit | Estimation formula |
|---|---|---|---|
| Storage | Data stored over time | GB-month | avg_GB × price_per_GB_month |
| Requests | Operations on objects and metadata | per 1k / 10k requests | (GETs×p_get + PUTs×p_put + LIST×p_list + …) |
| Retrieval | Reading data from colder tiers | GB retrieved / restore | retrieved_GB × price_per_GB |
| Egress | Data leaving a region/provider network | GB transferred | egress_GB × price_per_GB (by destination) |
Don’t estimate with a single “requests” line
Providers price request types differently. PUT/COPY/POST/LIST are often priced differently from GET/HEAD. Your estimation worksheet should separate request categories, even if you later group them.
3. Request charges: PUT/GET/LIST (and hidden multipliers)
Request pricing is how storage providers charge for operational load. It matters most for workloads with many small objects, heavy metadata traffic, or high fan-out reads.
Requests you should track explicitly
- PUT / POST / COPY: uploads and writes (often priced higher than reads).
- GET / HEAD: reads and metadata checks.
- LIST: enumerating objects (often expensive and easy to accidentally spam).
- DELETE: usually cheap, but still worth tracking at scale.
- Lifecycle transitions: moving objects between classes can create request-like charges.
Hidden multipliers that inflate request counts
- Multipart uploads: large uploads may create multiple “part” requests plus a final complete request.
- Retries and timeouts: a small error rate turns into a large request multiplier at high volume.
- CDN miss storms: if caching is misconfigured, origin GETs spike and costs follow.
- Background jobs: indexing, antivirus scanning, processing pipelines, and “list everything nightly” scripts.
- Small-object tax: transferring 1 GB as 1,000 objects is very different from 1 object (requests dominate).
Example: why “LIST in production” is a red flag
A LIST call can translate into multiple internal operations and can be charged as a premium request type. If an app lists a prefix on every page load, you can create a predictable cost spike. In most systems, it’s better to keep an index in a database and fetch objects by key.
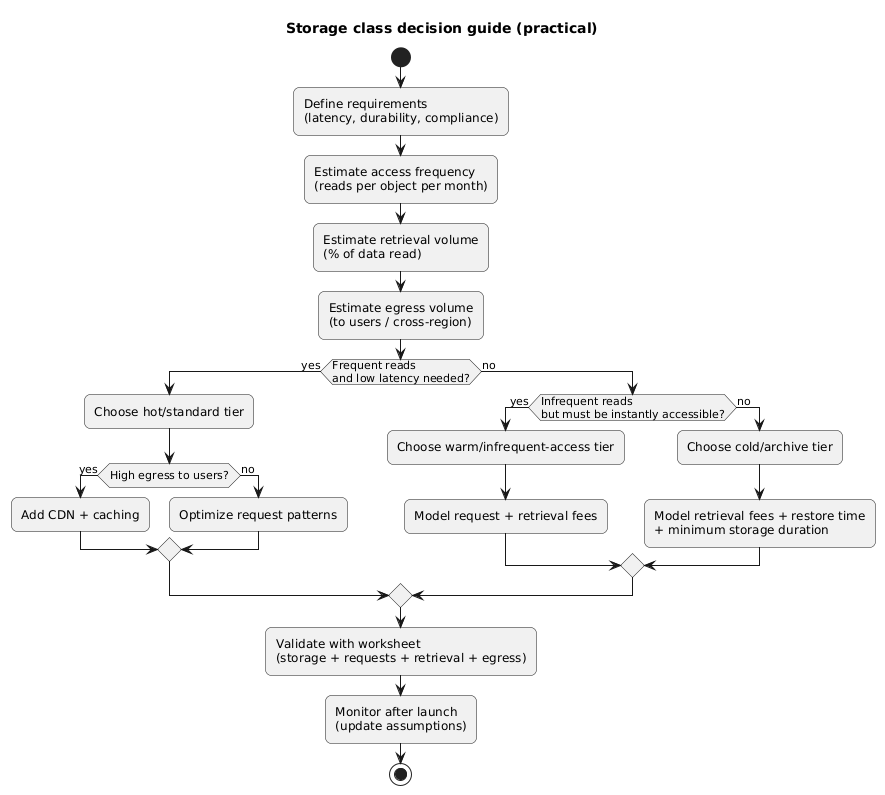
4. Retrieval fees and minimum storage duration (cold tiers)
Cold storage classes are designed for data you rarely access. Their GB-month rate is low, but you pay in other ways: retrieval fees, restore delays, minimum storage duration, and sometimes early deletion charges.
What “retrieval” usually means
- Per-GB retrieval: charged when you read bytes from cold storage.
- Restore operations: some tiers require a restore step before data is readable.
- Minimum storage duration: if you delete or transition too early, you may pay as if it stayed longer.
- Minimum billable object size: small objects may be billed as if they were larger.
Cold tiers punish “frequent reads”
If you read a meaningful fraction of your cold data every week (or day), cold storage is usually a false economy. Your estimate must include retrieval volume, not just total stored volume.
Storage class decision guide (diagram)
5. Egress and transfer: where the real money goes
Egress is any data leaving a region or leaving the provider’s network, and it can dominate costs when you serve files directly to users or move data across regions. Many teams underestimate egress because it feels like “networking,” not “storage.”
Common egress destinations you should separate in estimates
- To the public internet: users downloading images, videos, backups, installers.
- Cross-region: replication, disaster recovery, active-active services.
- To another cloud: migrations, analytics, ML pipelines, vendor integrations.
- To CDN edge: often cheaper than direct origin egress, but not free.
- To on-prem: restores and exports.
Egress-first design principle
If users download your objects, plan a delivery layer (CDN, caching, compression, range requests) early. You can reduce egress and request costs together by improving cache hit rate and object design.
6. Common scenarios and how to estimate them
The fastest way to create a realistic cost model is to pick the scenario that matches your workload and fill in the variables. Below are the typical storage use cases and the cost drivers that matter most.
| Scenario | Dominant cost drivers | What to measure | Common mitigation |
|---|---|---|---|
| Static assets for a web app | Egress + GET requests | GB delivered, cache hit rate, GET count | CDN, caching headers, bundle objects, compression |
| Backups / archives | Storage + occasional retrieval | GB-month, restore frequency, restore size | Cold tier, lifecycle policies, test restores |
| Data lake / analytics | GET/LIST + cross-service transfer | Scan volume, file sizes, listing patterns | Partitioning, compact files, avoid LIST loops |
| User uploads (photos/videos) | Egress + processing reads | Upload PUTs, processing GETs, delivery GB | CDN, thumbnails, pre-signed URLs, tiering |
Example estimation (generic numbers)
Suppose you store an average of 2,000 GB, serve
300 GB to users, and run
3,000,000 GET plus
120,000 PUT requests per month. Your estimate
becomes:
Storage = 2,000 × $/GB-month
Requests = 3,000,000 × $/GET + 120,000 × $/PUT (+
LIST/other if applicable)
Egress = 300 × $/GB egress
Then add retrieval only if you use cold tiers or restore operations.
7. Estimation worksheet (copy/paste)
Use this worksheet as your “source of truth” for forecasting and for post-launch validation. Fill it once, then update monthly as you gather real usage metrics.
Cloud storage cost estimation worksheet (monthly)

A) Storage (GB-month)
- Avg stored GB:
- Price per GB-month:
= Storage cost:

B) Requests (count)
- PUT/POST/COPY count:
- Price per 1,000 (or 10,000) PUTs:
= PUT cost:

- GET/HEAD count:
- Price per 1,000 (or 10,000) GETs:
= GET cost:

- LIST count:
- Price per 1,000 (or 10,000) LISTs:
= LIST cost:

- Other (delete, lifecycle transitions, multipart parts, etc.):
= Other request cost:

C) Retrieval (GB) (only if using colder tiers)
- Retrieved GB (reads/restores):
- Price per GB retrieved:
= Retrieval cost:

- Early deletion / min duration penalties (if applicable):
= Penalty cost:

D) Egress (GB)
- To public internet GB:
- Price per GB:
= Internet egress cost:

- Cross-region transfer GB (if applicable):
- Price per GB:
= Cross-region cost:

- CDN / edge transfer GB (if applicable):
- Price per GB:
= CDN-related cost:

E) Safety margin
- Add % headroom for retries, spikes, backfills (recommended: 10–30%):
= Margin:

TOTAL = A + B + C + D + E
How to make this worksheet accurate quickly
Start with conservative assumptions, then replace them with real metrics: request counts by type, bytes retrieved, and egress by destination. After one month of real traffic, your forecast should be within a tight band.
8. Practical optimizations that actually move the bill
Cost wins come from changing the dominant component. If egress dominates, optimizing requests won’t help much. If requests dominate, switching tiers won’t help much. Start by ranking the four components.
When requests dominate
- Reduce small-object overhead: bundle, batch, or store as larger chunks where feasible.
- Avoid LIST in hot paths: use indexes/metadata stores instead of scanning prefixes repeatedly.
- Cache aggressively: CDN in front of buckets; cache headers that match your app’s reality.
- Control retries: exponential backoff; avoid thundering herds during incidents.
When retrieval dominates (cold storage)
- Move “warm” data out of cold tiers: don’t pay retrieval for frequently accessed data.
- Prefetch in batches: reduce repeated small restores.
- Tier by policy: lifecycle rules based on last-access time (when available) or business logic.
When egress dominates
- Put a CDN in front: improve cache hit rate and reduce origin egress and GETs.
- Compress and resize: images/video variants; avoid shipping raw assets to clients.
- Use range requests: for large media downloads; reduces bytes transferred when users don’t watch all content.
- Keep compute close to data: avoid cross-region reads and “data gravity” mistakes.
9. Debugging a storage bill (what to check)
When your invoice spikes, you want a repeatable approach: identify which of the four components changed, then map it to a product or code path. The goal is to move from “the bill is higher” to “this API endpoint caused it.”
Cost estimation & monitoring loop (diagram)
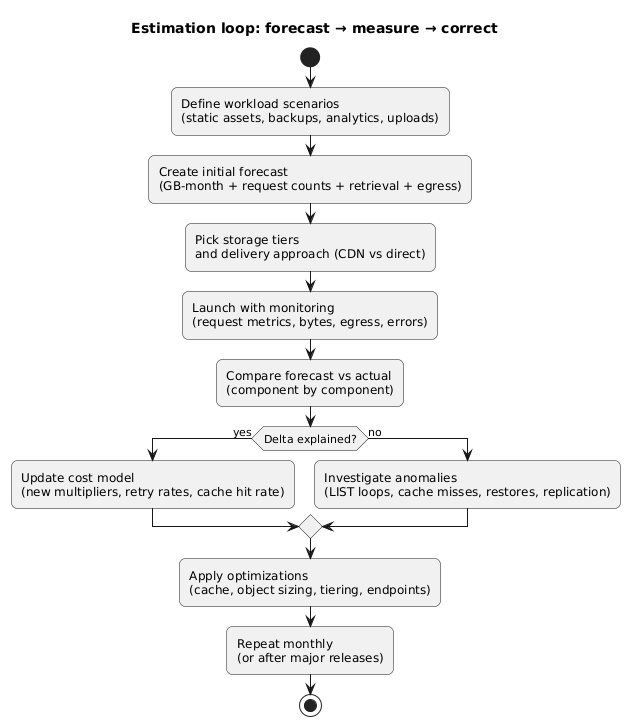
Fast triage questions
- Did stored GB increase? (new data, failed lifecycle, replication growth)
- Did request counts spike? (cache misses, retries, LIST loops, background jobs)
- Did retrieval spike? (cold tier accessed more, restores triggered by new feature)
- Did egress increase? (new downloads, region changes, multi-region reads, CDN bypass)
Billing spikes are often “one line of code”
A single change—like listing a prefix for every request or disabling caching—can increase request and egress costs by orders of magnitude. Treat storage access patterns as production-critical behavior.
10. Cost estimation checklist
- Storage: estimated average GB-month (not peak GB only).
- Requests: counts split by type (PUT/GET/LIST at minimum), plus expected retry rate.
- Object design: expected object size distribution (small-object tax accounted for).
- Retrieval: whether you use cold tiers; expected retrieved GB and restore patterns.
- Minimums/penalties: minimum storage duration or early deletion considered for tiering policies.
- Egress: GB by destination (internet, cross-region, CDN/edge, on-prem/other cloud).
- Controls: caching strategy, lifecycle rules, and monitoring dashboards planned.
- Headroom: margin for spikes, backfills, and incident behavior.
11. FAQ
What’s the fastest way to reduce cloud storage cost?
First identify the dominant component. If egress dominates, put a CDN and improve cache hit rate. If requests dominate, reduce LIST usage and small-object patterns. If retrieval dominates, stop using cold tiers for warm data. Tiering only helps when access frequency matches the tier.
How do I estimate request counts before launch?
Start from product usage metrics: page views, API calls, background jobs. Translate each action into storage operations (e.g., “view profile photo” = 1 GET unless cached). Then apply a conservative retry multiplier and include metadata calls.
Does replication increase cost?
Usually yes: you store the data twice (or more), and you may pay transfer for cross-region replication depending on the provider. Replication is a reliability feature; treat it as a deliberate cost trade-off with clear RPO/RTO goals.
Key terms (quick glossary)
- GB-month
- Storage billed as average gigabytes stored over a month (time-weighted).
- Request charges
- Pricing based on operation counts such as PUT, GET, LIST, and metadata actions.
- Retrieval fees
- Additional charges for reading data from colder storage tiers, often per GB retrieved or per restore.
- Minimum storage duration
- A rule where deleting or transitioning objects too soon can trigger a charge as if they stayed longer.
- Egress
- Data transfer leaving a region or the provider network (often the biggest surprise on storage bills).
- Small-object tax
- When many small objects inflate request counts and overhead compared to fewer larger objects.
Worth reading
Recommended guides from the category.