
Most ML failures in production do not look like dramatic outages. They look like quiet degradation: a fraud model that approves slightly more bad transactions, a classifier that routes slightly more tickets to the wrong queue, a ranking model that slowly erodes conversion, or an LLM assistant that becomes less helpful as product and policy content changes.
This is model drift: the gradual (or sudden) mismatch between the world your model was trained on and the world it is now operating in. Drift is not rare. If your product changes, users change, competitors change, seasonality exists, or data pipelines evolve, drift is guaranteed.
A useful operating principle
Drift monitoring is a reliability practice. Treat it like SRE treats latency and error budgets: you need dashboards, action-oriented alert thresholds, and a response runbook tied to business impact.
1. What model drift is (and why it is inevitable)
A deployed model is a bundle of assumptions: input distributions, feature meanings, label definitions, and a relationship between inputs and outcomes. Drift occurs when those assumptions change.
In production monitoring, it helps to separate:
- Data drift: input distributions changed (features, text, embeddings, missingness).
- Concept drift: the mapping from inputs to labels changed (behavior patterns evolve).
- Label/target drift: the outcome distribution changed or label policy moved.
A model can drift without obvious performance loss (benign drift), and performance can drop without obvious drift metrics (silent concept drift or a pipeline bug). That is why a reliable setup is layered: data quality → drift signals → performance signals → response playbook.
2. Types of drift: data, concept, and label drift
2.1 Data drift (covariate shift)
Data drift means the distribution of input features changes compared to a baseline. Common examples:
- new countries or languages appear after expansion,
- marketing campaigns bring different cohorts,
- UX changes alter how users enter text,
- upstream pipeline changes increase missing values,
- new devices or app versions change telemetry distributions.
2.2 Concept drift
Concept drift means the relationship between inputs and the correct output changes. Typical drivers: adversaries adapt (fraud/spam), customer intent shifts after pricing or policy changes, or new product categories change what “normal” looks like.
2.3 Label drift (target drift)
Label drift means the prevalence of outcomes changes or labeling policy changes. This affects calibration and decision thresholds: a classifier trained on one class prior can become miscalibrated when priors shift.
A common trap
Teams monitor only input drift. Input drift can correlate with performance degradation, but it is not performance. You still need performance monitoring (labels, delayed labels, human review, or strong proxies).
3. Why drift happens in production systems
Drift is rarely “the model got old” in isolation. It usually comes from one of these categories:
3.1 Real-world change
- seasonality and calendar effects (holidays, end-of-month),
- macro events (regulatory changes, supply shocks),
- adversaries adapting (fraud, spam, abuse),
- new competitors and changing user expectations.
3.2 Product change
- new features and new intents,
- changed UI flows that alter user inputs,
- pricing changes that shift customer behavior,
- new markets and locales.
3.3 Data pipeline change (often the real culprit)
- schema changes, new enums, new default values,
- logging changes (sampling, truncation, encoding),
- feature computation changes or training/serving skew,
- upstream outages causing missingness or fallback logic.
This is why drift response begins with data integrity. A pipeline bug can masquerade as drift and destroy performance quickly.
4. Set up drift monitoring correctly: baselines, windows, and slices
4.1 Choose baselines that match “healthy production”
Your baseline should reflect a period where:
- the model was stable and performing acceptably,
- data pipelines were known-good,
- traffic represented typical users (not only a launch cohort).
For long-lived systems, keep multiple baselines:
- Training baseline: the distribution your model learned from.
- Healthy serving baseline: a good production window after launch.
- Seasonal baseline: last year’s same-period distribution for seasonal businesses.
4.2 Use rolling windows (multiple timescales)
Common pattern:
- Short window: last 1 hour / 1 day to detect sudden shifts (pipeline changes).
- Medium window: 7 days to smooth noise.
- Long window: 30 days to observe slow drift.
4.3 Slice monitoring: drift is rarely uniform
Many incidents are localized (one country, one device type, one acquisition channel). Slice dashboards help you find the failure fast.
High-value slices:
- country / language / locale,
- device / OS / app version,
- new users vs returning users,
- marketing channel / campaign,
- product category, plan type, or customer tier,
- high-value accounts (enterprise) vs long tail,
- time-of-day / day-of-week.
4.4 Define “what matters” (drift budget)
If you do not define what changes are acceptable, your alerts will be either too noisy or too quiet. A practical approach is to define:
- Business impact tolerance: e.g., “p95 precision must not drop below X.”
- Operational tolerance: e.g., “manual review rate must not exceed Y.”
- Response SLA: warning alerts investigate within N hours; critical alerts mitigate immediately.
5. Detect drift: metrics, tests, and thresholds that work
No single metric is perfect. Use a small set that covers numeric, categorical, and text/embedding features, plus output signals (prediction and confidence drift).
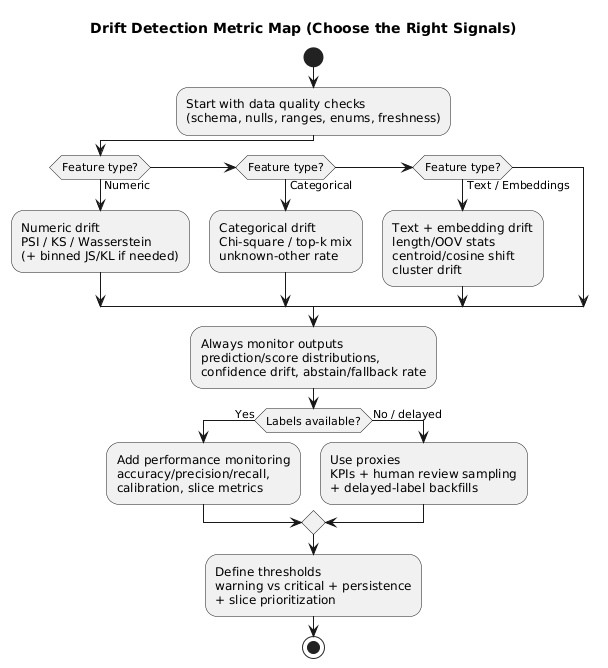
5.1 Data quality checks (catch pipeline issues first)
- missing values and null rates,
- range checks (min/max),
- schema consistency and enum cardinality,
- unexpected spikes in “unknown” or default values,
- feature freshness and latency (stale joins, delayed events).
5.2 Drift metrics: a practical toolkit
| Feature type | Recommended metrics/tests | Why it helps | Common pitfall |
|---|---|---|---|
| Numeric | PSI, KS statistic, Wasserstein distance, JS/KL (binned) | Detects distribution shifts and shape changes | Over-alerting at high traffic; bad binning |
| Categorical | Chi-square, top-k tracking, unknown/other rate | Finds new categories and mix changes | Cardinality explosions hide real movement |
| Text / Embeddings | Embedding centroid shift, cosine distance, cluster drift, OOV/length stats | Captures language/topic drift beyond simple tokens | Ignoring preprocessing differences (tokenization/cleaning) |
| Outputs | Prediction distribution, score distribution, confidence drift, abstain/fallback rate | Early warning when feature monitoring is incomplete | Assuming output drift means failure (sometimes benign) |
5.3 Practical thresholding (avoid alert fatigue)
- Two thresholds: warning (investigate) and critical (mitigate).
- Persistence: alert only if drift persists across N windows.
- Prioritize impact: alert only on high-importance features and critical slices.
- Change-point logic: detect jumps, not every fluctuation.
Statistical significance is not business significance
With large traffic, tiny shifts can be statistically significant. Thresholds must be tuned to what changes outcomes, not what changes p-values.
6. Monitor performance when labels are delayed or missing
If you wait for ground truth, you may discover drift weeks late. Use layered signals and backfill evaluation once delayed labels arrive.
6.1 Proxy metrics tied to business outcomes
- fraud: chargeback rate, manual review rate, false decline complaints,
- support routing: reassignment rate, resolution time, escalation rate,
- recommendation: click-through rate, conversion, churn,
- search: zero-result rate, query reformulation rate.
6.2 Human-in-the-loop sampling (monitoring + labeling stream)
Sample predictions for review using a mix of:
- random sample (overall health estimate),
- high-confidence sample (catch overconfidence failures),
- uncertainty sample (boundary cases),
- slice-based sample (countries/devices/new categories).
6.3 Shadow evaluation and delayed-label backfills
When shipping a new model, run shadow comparisons (agreement rate, output drift, KPI correlations), then backfill true performance once labels arrive. This reduces “great offline, bad online” incidents.
7. Alerting that leads to action (not noise)
Alerts should answer: who does what, by when, and how do we verify success? If an alert is not tied to a runbook step, it is an FYI, not an alert.
7.1 A practical alert taxonomy
- Data integrity alerts: schema mismatch, null spikes, enum explosions (highest priority).
- Drift alerts: significant and persistent shift on key features or slices.
- Performance alerts: degradation on labeled stream, human review, or KPI regression.
- Guardrail alerts: increased fallbacks, refusals, constraint violations (LLM systems).
7.2 Include investigation context in the alert
- which feature(s) drifted and how much,
- which slice is affected,
- baseline vs current window,
- links to dashboards for drill-down,
- recent deployments or pipeline changes in the same timeframe.
8. Response playbook: triage, mitigations, retraining, rollback
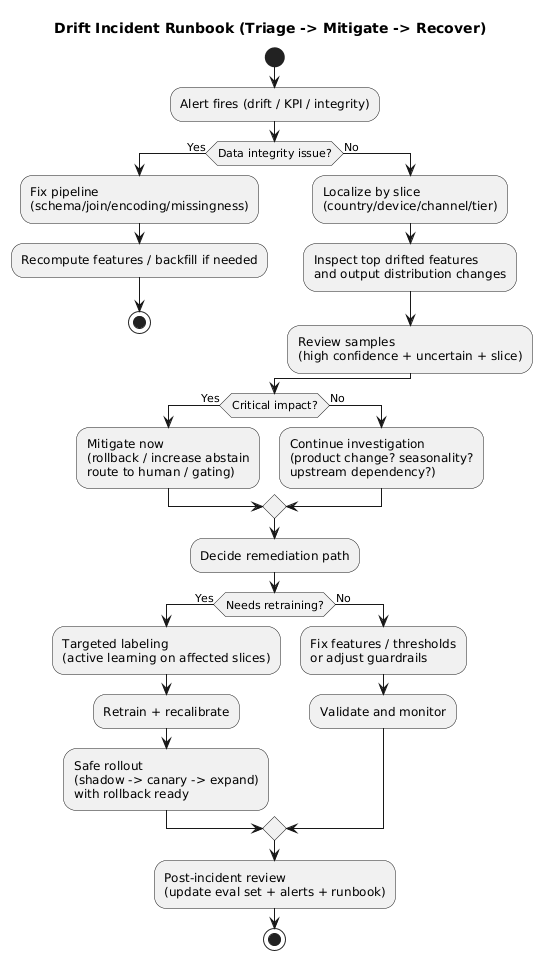
8.1 Triage: drift or data bug?
- Check data integrity: null spikes, schema mismatch, broken joins, encoding problems.
- Check recent changes: pipeline deploys, upstream API changes, product releases, experiment flags.
- Localize by slice: country/device/channel—where is it concentrated?
- Review samples: compare failure patterns to last healthy baseline.
8.2 Immediate mitigations (minutes to hours)
- Rollback to the previous model version if the new version is implicated.
- Fallback logic: increase abstain thresholds, route to human review, apply conservative rules.
- Threshold tuning: temporary compensation for shifted priors.
- Feature disablement: remove corrupted features or switch to stable fallbacks.
- Gating/rate limiting: reduce exposure while investigating.
8.3 Medium-term fixes (days)
- Targeted labeling for drifted slices (active learning).
- Retraining with refreshed data and updated labeling policy.
- Feature updates to handle new categories/language/behaviors.
- Calibration refresh if score distributions moved.
8.4 Long-term improvements (weeks)
- expand evaluation sets with incident learnings and slice coverage,
- add stronger data validation gates in CI/CD,
- improve dashboards and alert routing,
- combine scheduled retraining with drift-triggered retraining,
- tighten governance for feature and labeling policy changes.
Treat rollback as a feature
If you cannot roll back quickly, you do not have a reliable ML system. Version model artifacts, keep the serving stack compatible, and practice rollback as part of release engineering.
9. Drift in LLM and RAG systems: prompts, retrieval, tools
In LLM systems, “the model” is more than weights. It includes prompts, retrieval corpora, tool behavior, and guardrails. When an assistant “got worse,” the root cause is often upstream.
9.1 Prompt drift (prompts are code)
- system prompt changes,
- template variables added/removed,
- tool descriptions changed,
- policy rules updated.
Version prompts, review changes, and monitor behavior shifts after edits.
9.2 Retrieval drift (RAG)
- knowledge base updates change what is retrieved,
- embedding model changes shift neighbors,
- chunking logic changes affect context quality,
- authorization filters break and leak or hide documents.
Monitor RAG-specific signals: retrieval hit rate, top-k similarity, chunk lengths, citation coverage, and the share of answers produced without retrieval (when applicable).
9.3 Tool drift
- API schemas change,
- latency changes cause timeouts and fallbacks,
- output formatting changes break parsers,
- permissions change alters accessible data.
Tool drift often appears as parsing failures, retries, or fallback usage. Treat those as reliability metrics.
LLM drift is often pipeline drift
If an LLM assistant “got worse,” investigate retrieval, prompts, tools, and guardrails before blaming the base model. Monitor the full chain, not just the final text output.
10. Reference architecture for drift monitoring (implementation blueprint)
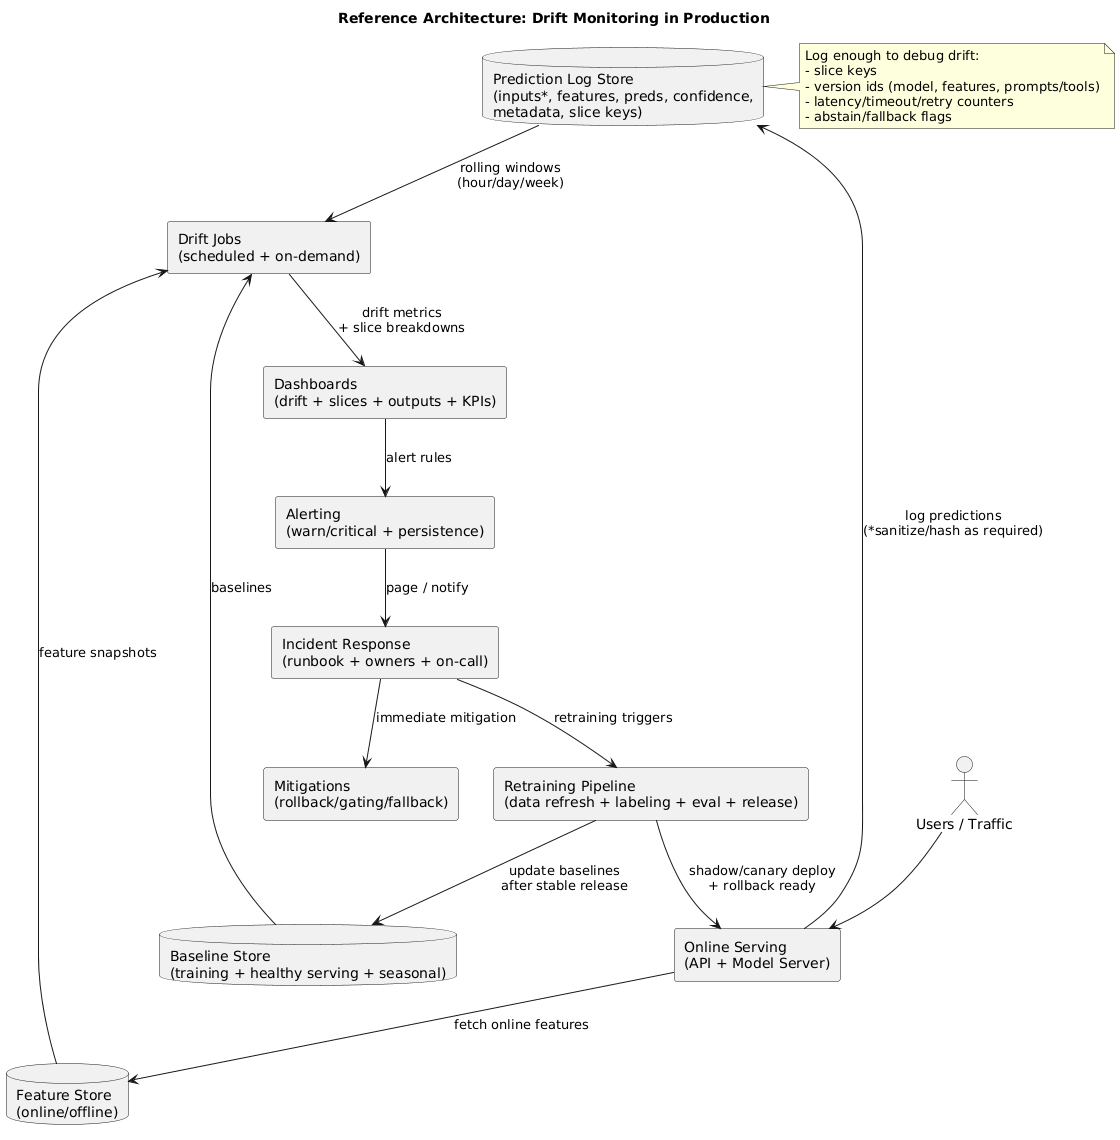
A reliable production setup separates collection, comparison, decision, and response. A practical blueprint:
- Logging: persist inputs (or hashed/sanitized forms), key features, predictions, confidence, and metadata (slice keys).
- Baselines: store training and healthy-serving baselines, plus seasonal baselines when relevant.
- Drift jobs: scheduled computations for data quality + drift metrics across windows and slices.
- Dashboards: top drifted features, affected slices, output drift, and correlated KPI changes.
- Alerting: warning vs critical; persistence; action links; ownership and on-call routing.
- Response: runbook-driven triage and mitigations; retraining triggers; gated rollout and rollback.
11. Practical checklist (copy/paste)
- Define drift types you care about and what “impact” means for the business.
- Choose baselines: training, healthy-serving, and seasonal (if needed).
- Set windows: short + medium + long timescales.
- Start with data quality: schema checks, null spikes, enum explosions, freshness.
- Monitor feature drift with PSI/KS/Wasserstein (numeric) and chi-square/top-k (categorical).
- Monitor output drift: priors, score distributions, confidence, calibration proxies, abstain/fallback rates.
- Slice dashboards: locale, device, channel, tier, and other critical cuts.
- Alert design: warning vs critical + persistence + runbook actions.
- Monitor without labels: proxies + human review sampling + delayed-label backfills.
- Write the runbook: integrity → localization → sample review → mitigation decision.
- Safe releases: canary/shadow, metric gates, rollback practice.
- Continuous improvement: feed incidents into eval sets, validation gates, and retraining triggers.
12. Frequently Asked Questions
What is model drift?
Model drift is the change over time in data, relationships, or outcomes that causes a deployed model to behave differently than it did during training and validation. It commonly appears as data drift, concept drift, or label/target drift.
What is the difference between data drift and concept drift?
Data drift is a change in input distributions (cohorts, categories, language mix, missingness). Concept drift is a change in the mapping between inputs and the correct output (evolving fraud patterns, shifting customer intent). Data drift can be detected without labels; concept drift usually requires labels or human review.
How do I detect drift if labels are delayed or missing?
Use layered proxy signals: data quality checks, feature distribution drift, prediction and score distribution changes, confidence and calibration proxies, business KPIs, and periodic human review of sampled predictions—then backfill performance when delayed labels arrive.
How do I set drift thresholds without creating alert fatigue?
Use warning vs critical thresholds, require persistence across multiple windows, prioritize high-importance features and business-critical slices, and tie every alert to a runbook action. Statistical significance alone is not enough at high traffic.
What should a drift alert trigger?
An investigation workflow: verify pipeline health, localize the shift by feature and slice, review samples, check for product or business changes, and choose a mitigation path (rollback, threshold tuning, feature fixes, targeted data collection, retraining).
How often should I retrain a model to handle drift?
It depends on environment change rate and label latency. The most reliable approach combines scheduled retraining with drift- or performance-triggered retraining and strict deployment gates (canary/shadow + rollback).
Key terms (quick glossary)
- Model drift
- A change over time in live conditions that alters model behavior compared to training/validation.
- Data drift
- Changes in input distributions (covariate shift), including missingness and new categories.
- Concept drift
- Changes in the mapping from inputs to outputs, often requiring labels or human review to confirm.
- Label drift (target drift)
- Changes in outcome prevalence or labeling policy that affect calibration and thresholds.
- Slice monitoring
- Monitoring metrics on subgroups (locale/device/channel/tier) to localize drift and catch localized regressions.
- Shadow deployment
- Running a new model in parallel without affecting users to compare outputs and performance.
- Canary deployment
- Rolling out to a small share of traffic first, then expanding only if health metrics remain within bounds.
- Rollback
- Switching back to a previous known-good model version as an immediate mitigation.
Worth reading
Recommended guides from the category.